Attached below are two charts from the annual 2026 EquiPredict Stock Market Forecast report. The annual forecast was shared with members on January 1st, 2026.
The charts below show the progress of the annual forecast year-to-date.
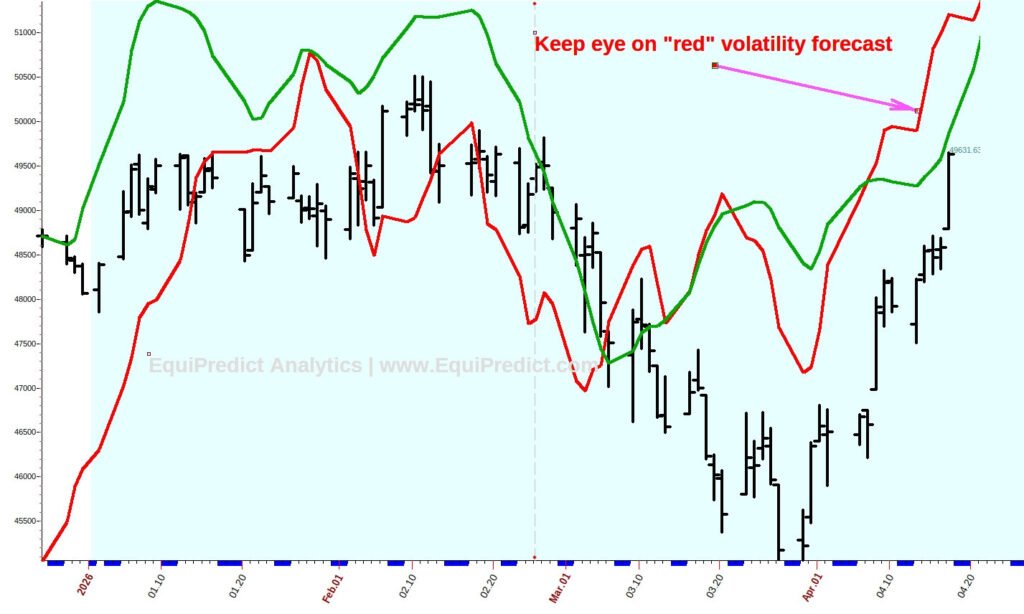
The charts are ‘zoomed in’ and the forecasts are unaltered. The original “single roadmap” forecast is found on Chart #1. Two of the three ‘volatility forecasts’ contained within the report are found on Chart #2.
Charts expand upon click.
Chart 1
The single roadmap (purple line) has provided members so far a decent guideline for what they should have been looking for in terms of bias (bullish or bearish/consolidation behavior) between January 1st and mid-April (YTD). The single roadmap forecast directed members to be on the lookout for a bullish turn in the market in early March after a period of bearish bias in mid February. The bullish change in trend materialized a few weeks later on March 26th.
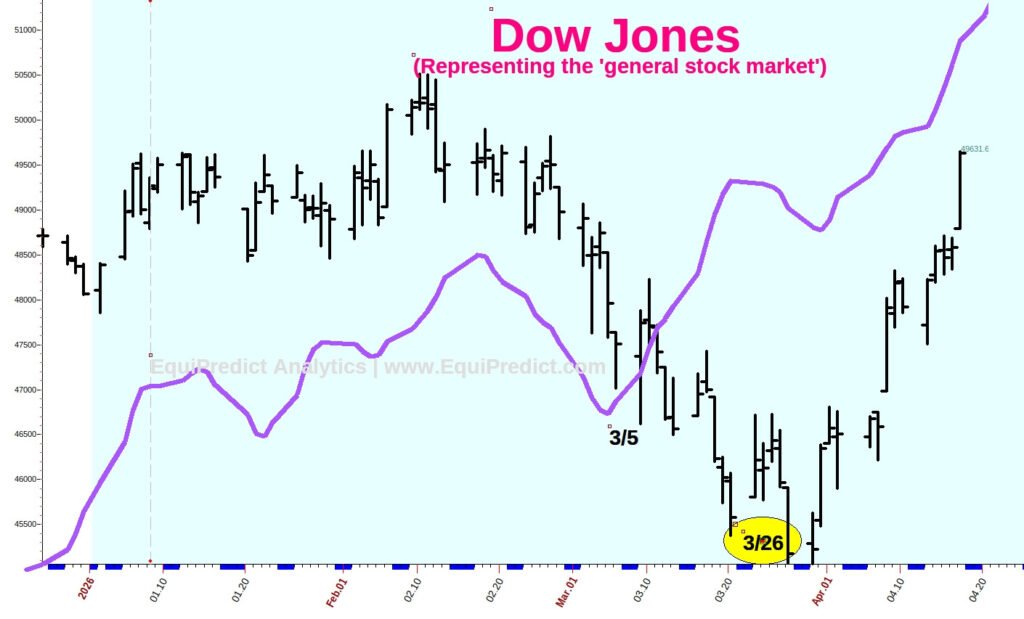
Chart 2
The annual forecast also included three “volatility scenarios” for the year ahead. The red scenario has tracked market behavior most closely so far, and members should focus on it going forward. It is also advisable to monitor the green scenario as well.
Important reminder: Unless otherwise specified, all Equipredict forecasts are purely calendar-tied, and forecast bias of a given market. The forecasts are not magnitude-of-move forecasts.
Free QQQ Timing Guide: