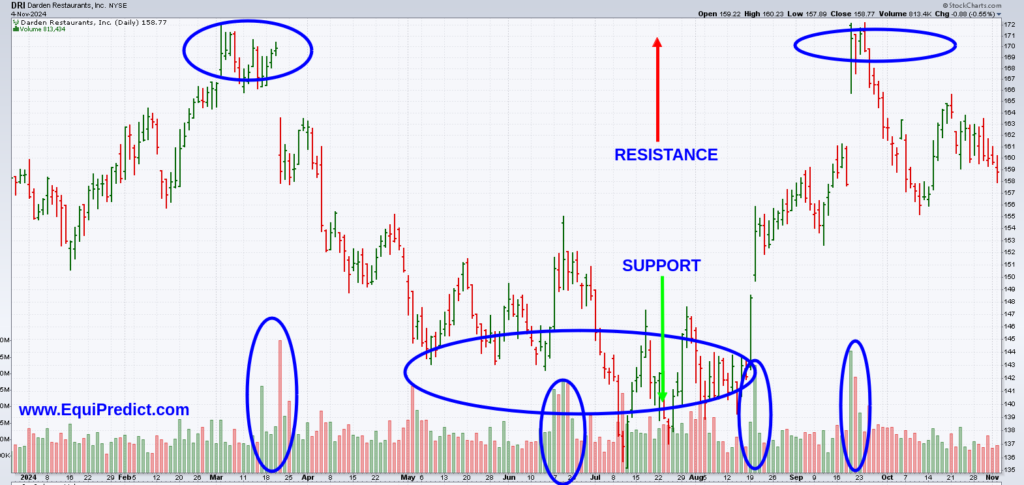
This is the chart of Darden Restaurants (Ticker: DRI), going back to the start of 2024.
Using only price action and volume, a trader can easily spot areas of support and resistance. These areas should be viewed as areas of opportunity.
In this example, we can see that price is pushed away from about $170 per share at the upside (resistance), and pushed away from the downside (support) near $142/share.
When price action approaches these areas, attention is warranted.
Using common sense logic (because we as analysts and traders tend to complicate simple analysis), the volume spikes tell a clear story about what Wall Street is doing.
The “average” volume bars are noise, but the spikes in volume are institutions stepping in.
Ignore the color of the bars. Simply note that there are a well-above average number of shares exchanged at the price points on this chart.
The bottom line:
Patience is key. We can conclude we have two trading opportunities at about $170/share and about $140/share.
- We’re looking for a strong breakout above $170/share to go long (buy to hold) to catch a new trend to the upside.
- We’re looking for price to return to near $142/share to acquire shares and ride a rebound to $170/share or even higher if it breaks out of the year-long consolidation pattern on the chart.
Remember – stop losses should be strictly minded in volatile markets!
To sign up to the free EquiPredict monthly forecast, use this link.
