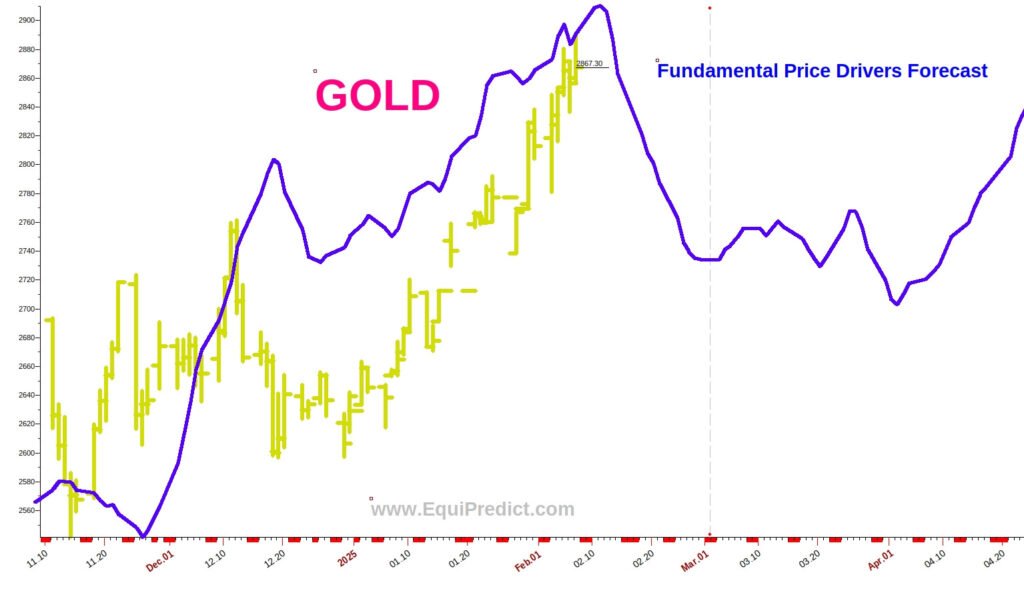
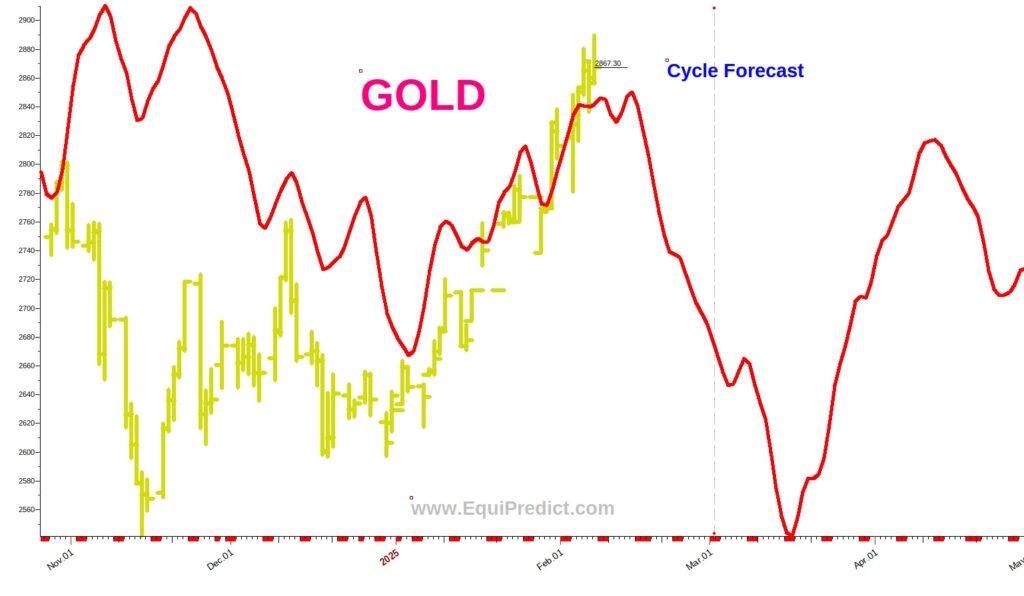
The 2 charts included here are of the forecast for gold prices (Spot Gold Price Chart). These charts are suitable for those interested in understanding where to expect the path of gold futures to traverse going into April.
The first chart (blue line) is a forecast using the drivers, or fundamentals, behind the price of gold. The second chart (red line) is an extraction of the operative cycles and our EP model forecast for the behavior of the price of gold. [Both charts expand on click.]
Both charts are flashing a warning signal tied to the current rally that kicked off as we turned into 2025.
Because of the strength of this rally, it is entirely possible for the price of gold to consolidate instead of fall as we approach April.
A new forecast for this commodity will be run on April 1st and made available to EP subscribers signed up to the Newsletter+Forecasts reports.
Happy trading.