The 3 charts included here are for those interested in understanding the rotation taking place from growth-type stocks to value-type stocks. To find this chart in the future, type “#growth” or “#value” into the search box.
Growth stocks can be categorized as quickly expanding and innovative companies (i.e.- Amazon, Google, Microsoft). Whereas value stocks are often considered to be companies that are well established, undervalued and produce items used each day in a household (i.e. – Unilever, Johnson & Johnson, Proctor and Gamble)
The black line on the charts is the RATIO of the two categories. When the black line is rising (going upward) it indicates Wall Street moving funds toward GROWTH stocks. When the black line is falling, it indicates their preference for VALUE stocks.
Chart 1 (pink line) is the general intermediate term cyclical model. It is pointing to a likely preference for growth stocks between now and the summer. However, please note, we believe this is a time to begin shopping for high quality VALUE stocks for 2026. During the summer, Wall Street is likely to begin rotating away from growth for an extended period into 2026.
Note: there’s an excellent growth-stock opportunity we are looking into beginning in mid-November that is a blue-wave cycle. We will be publishing more data on this temporary, counter-cycle growth rotation in the fall.
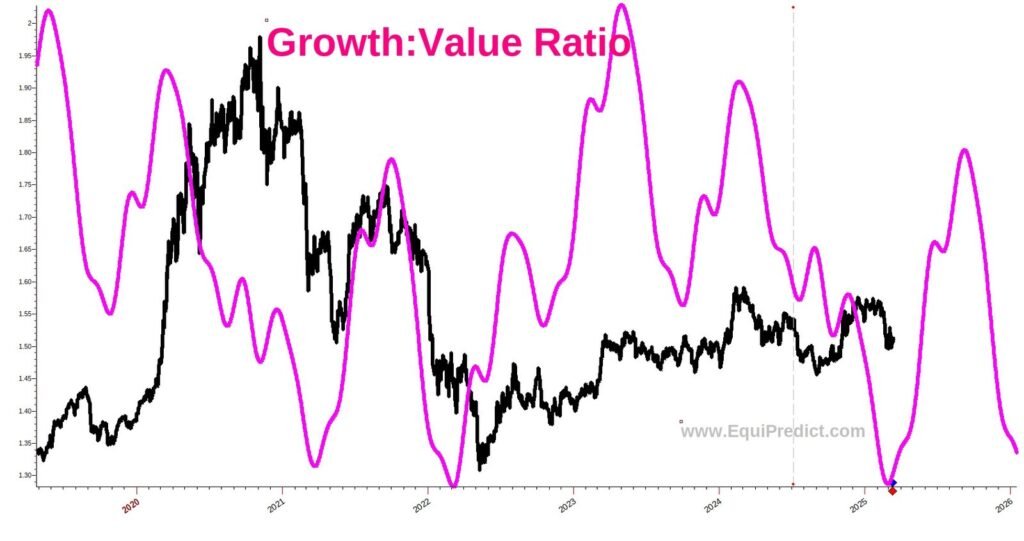
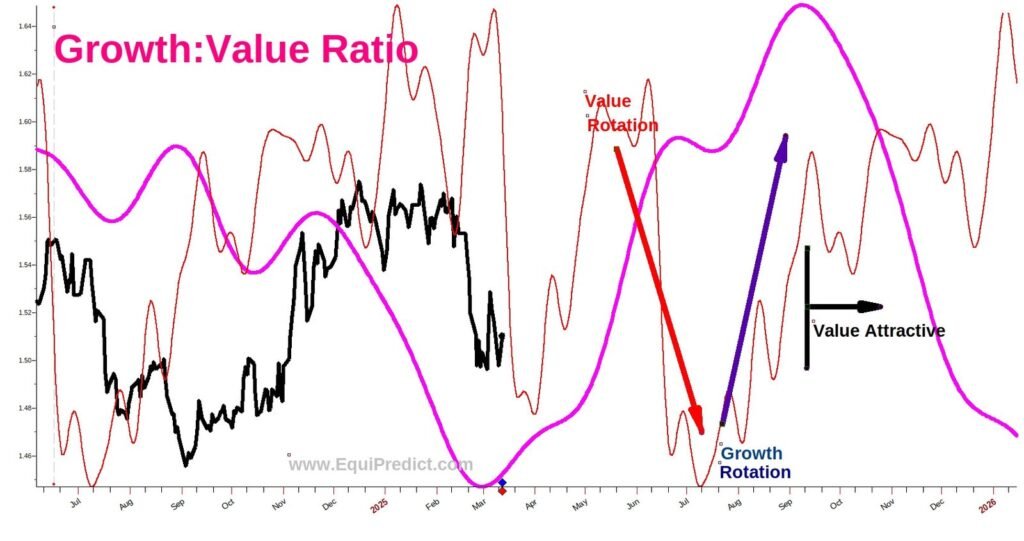
Chart 2 is the shorter-term, faster red-cycle waves overlaid on the intermediate pink-cycle wave. Chartists will note a likely rotation toward growth into late April, back to value into the summer, and then another rotation to growth in the fall before an earnest preference for value into 2026.
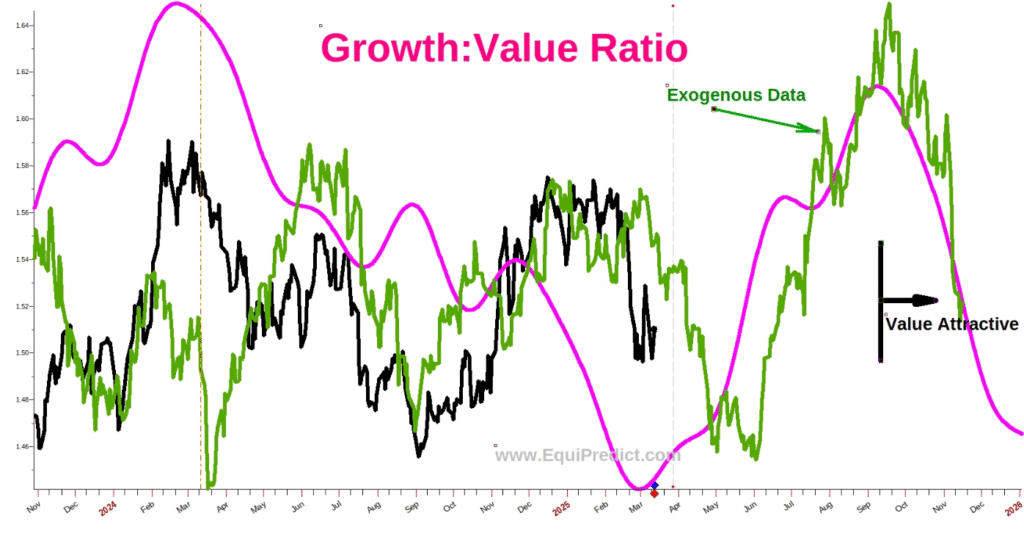
The last chart, Chart 3, is market-driving exogenous (non-cycle, non-EP model) data overlaid also adding weight to the forecast that the markets will see a temporary rotation to growth in the next few weeks.