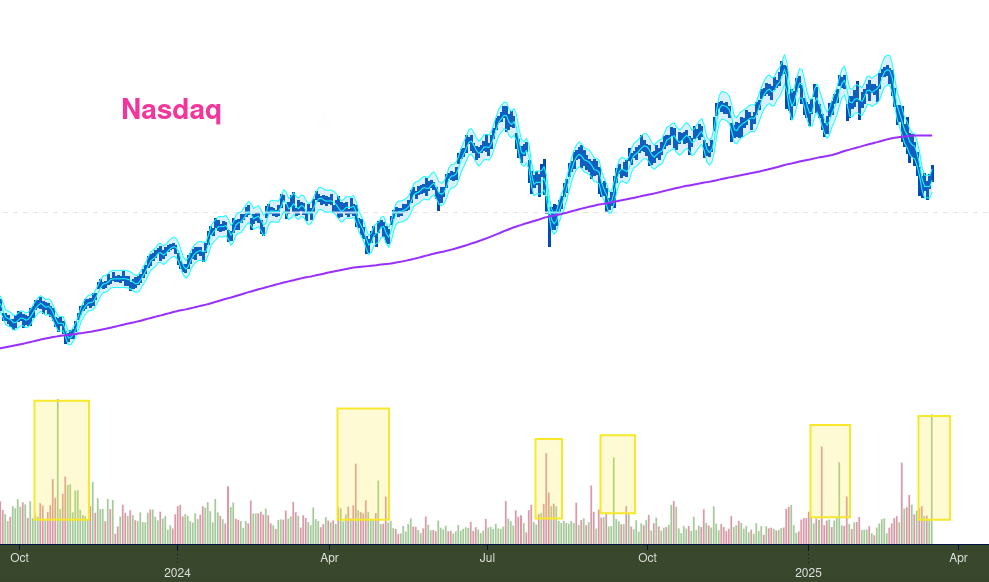
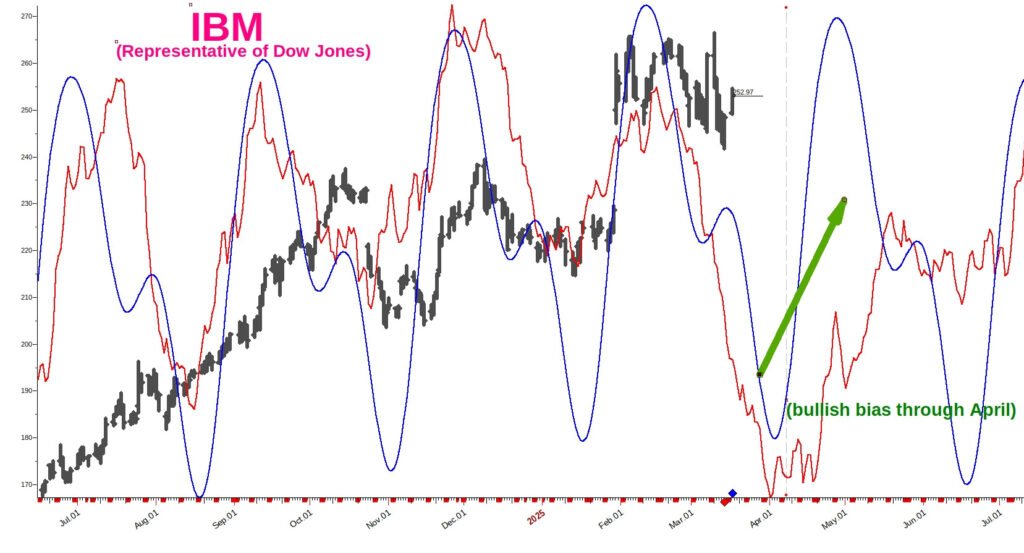
The two charts included here are of the leveraged Nasdaq ETF QLD and IBM. QLD represents the Nasdaq (growth oriented); and IBM is a stalwart of the US financial markets and considered a “value” oriented equity.
Yesterday, the QLD ETF saw the highest trading volume since October of 2023. These spikes in volume during extreme lows normally indicate a “capitulation” – meaning a sell-off that results in higher prices ahead. However, we did not see ‘capitulating price action’ to match this volume spike. Nonetheless, this spike in volume is indicative of institutional dollars (or “smart money”) taking action.
As retail traders, we’ll not know exactly what this volume spike means until some time passes. But we have some clues and evidence pointing to bullish bias until late April.
Here’s the breakdown:
- Volume spike in the Nasdaq
- Oil has begun to rally (bullish for markets)
- IBM is nearing a cycle trough with a cycle peak at end of April
What this all adds up to is the likelihood stock prices are funding support here and now.
The thing to watch for over the next month is this:
How bullish will the next trading month be?
If prices move sideways and find little lift, a next sell-off could be quite severe. On the other hand, if prices make a steady and stable (emphasis on stable) climb upward over the next month, the next corrective move in the markets come May into June could be muted.