There are 4 charts included in this article.
From top to bottom, here is a list:
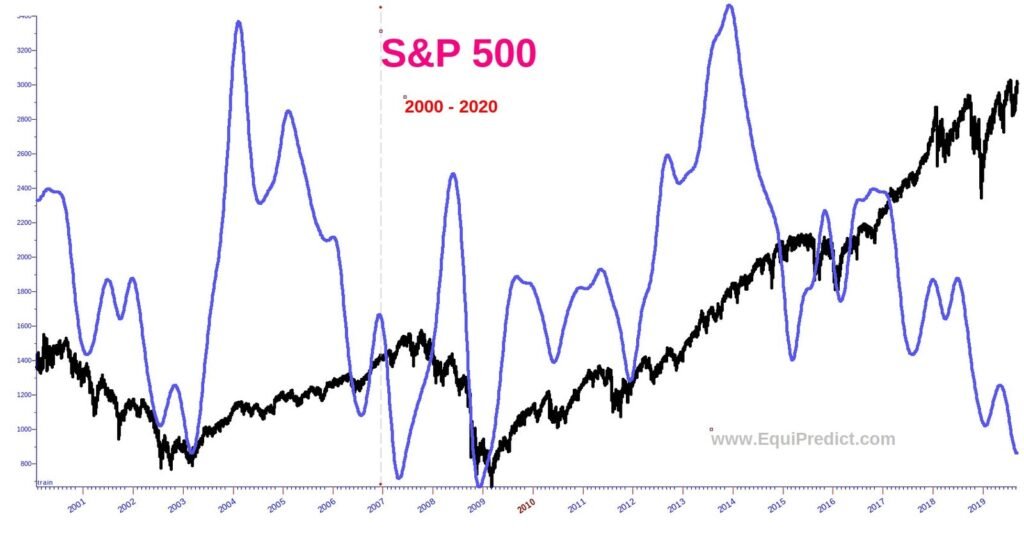
- S&P 500, Years 2000-2020 with 16.5 Year Cycle
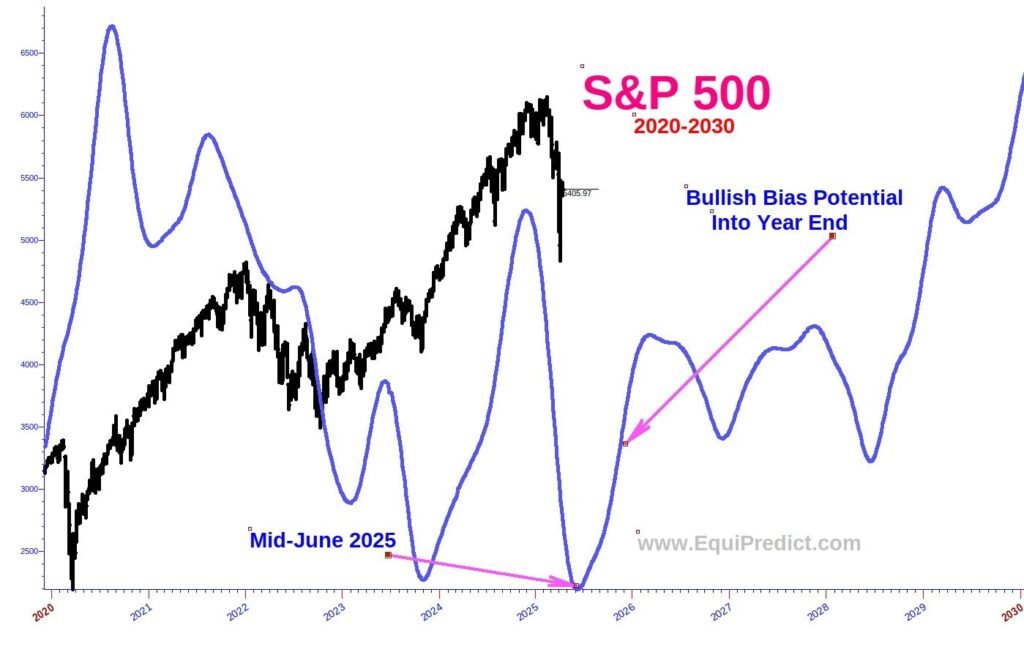
- S&P 500, Years 2020-2030 with 16.5 Year Cycle Forecast
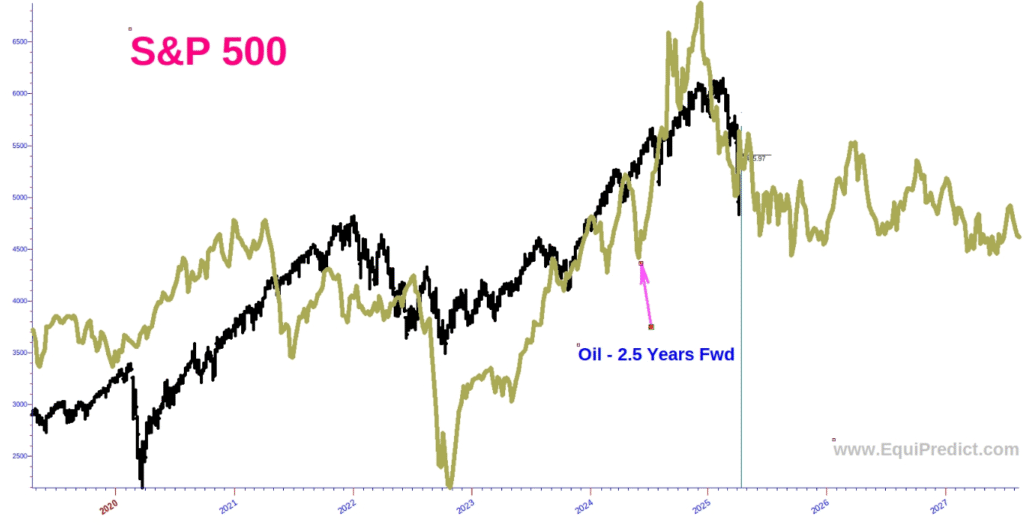
- S&P 500, Oil Prices overlaid, pushed forward 2.5 years
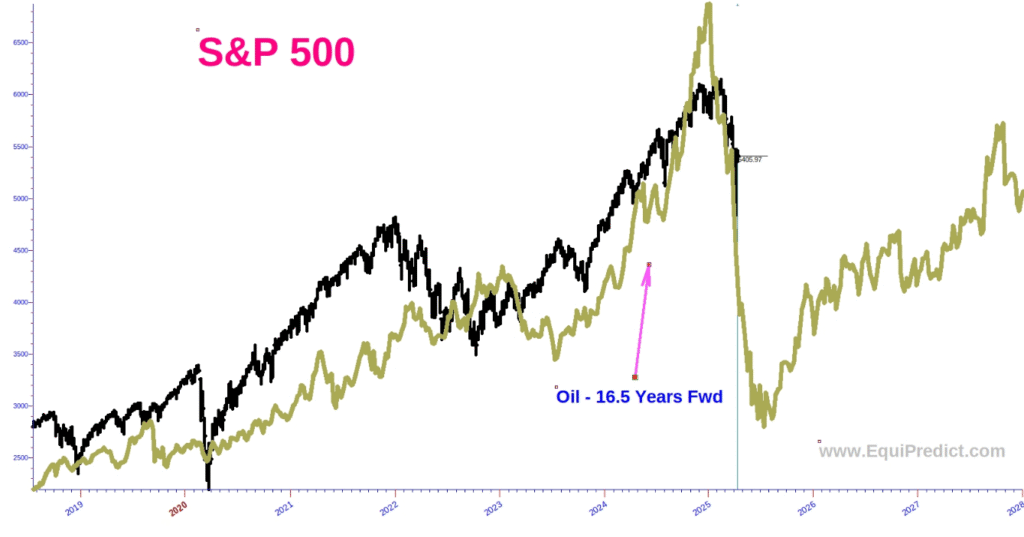
- S&P 500, Oil Prices overlaid, pushed forward 16.5 years
There are well known cycles built into our economy that the financial markets and economists are well aware of. Here are a few popular ones:
- The 15-17 year cycle
- The 9-10 year Juglar cycle
- The 39-40 month Kitchin cycle
- The 2.5 year business cycle
- and the Annual cycle.
If we run the 16.5 year cycle over the S&P 500, although not perfect, it once again gives us a guideline/roadmap for bias ahead. According to that larger cycle, bullish bias should start seeping into the markets by mid-this year. Sell-side liquidity may be drying up.
If we look at the cycle in oil prices, and push the price of oil forward by 2.5 and 16.5 years (bottom 2 charts), we can see that both also point to bullish bias soon.
Note: as mentioned in several prior posts, 2026 data looks a bit concerning at this point. We will be publishing detailed 2026 forecasts for the Dow Jones and the Nasdaq in December.
Each chart expands on click.