We’ve written extensively about how the Dow Jones is an excellent representative of the US economy and the broader US stock market.
Below (Chart 1) is the May 21st forecast from the “Vibrational Dow Jones Forecast” post, and the current results thus far (Chart 2) of that vibrational forecast. The forecast in May was created using only our EquiPredict Red Wave, cyclical forecasting model. A “bottom” in the Dow Jones was forecasted in late June before a resumption of the rally.
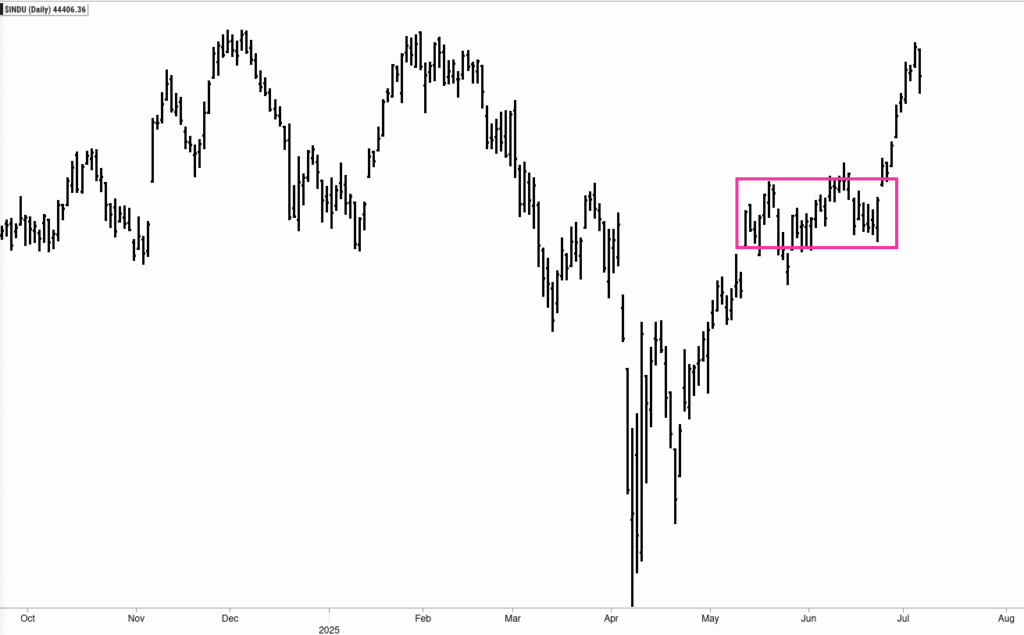
Price action meandered (drifted sideways) into that late June “trough” in the forecast instead of falling (see rectangle in Chart 2). When this occurs, the next leg up is generally very bullish. This is precisely what has taken place.

The movements of stock prices, however, are not mysterious nor are they driven by fixed cycles. Our Red, Blue and Green wave models are made more effective by matching them up with composites of “driver” data to reveal what pushes and pulls price action over time.
The forecast below (Chart 6, bottom of page) is only using “driving data” (in this case, a composite of commodity-linked data) to give us a glimpse into the future to see how the Dow Jones, and the stock market, are likely to behave over the coming weeks.
Charts 3 through 5 are prior forecasts. Chart 6 is the forecast using data up to today, July 8th 2025. With this data, we can see approximately 1.5-2 months ahead. The forecasts here aren’t perfect, but they do give us a sense of the bias (bullish/bearish) in the markets over the coming months by knowing what DRIVES price action in the markets.
NOTE: the blue shaded areas are OUT of sample – meaning the data in the blue shaded area is NOT used to create the forecast. Only the IN sample data (the white area of the screens) is used to create the forecasts.
Chart 6 is pointing to generally bullish bias into mid to late August. For our group members who have been with us for some time, this mid- to late August time-frame is a reoccurring theme across most of the varied ways we approach the markets.
Each chart expands upon click