Included here are two forecast charts. Some investors may not be familiar with these charts. If so, please read the below note in its entirety.
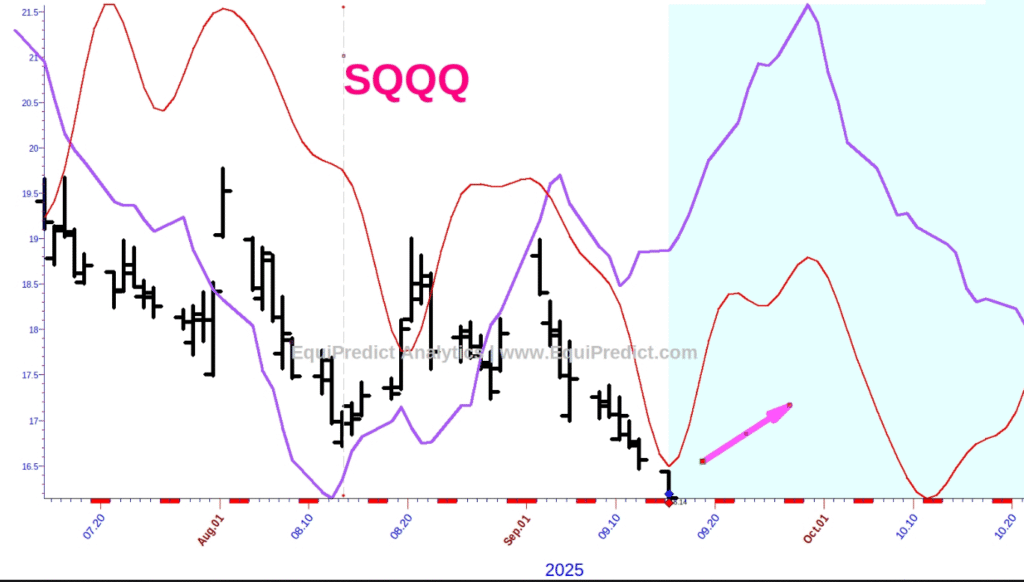
Chart 1 is of the ProShares UltraPro Short QQQ ETF (Ticker: SQQQ). This ETF is triple inverse QQQ ETF. In other words, if QQQ (the Nasdaq) rises by 2%, SQQQ will fall by 6%. SQQQ is used by those who anticipate bearishness in the market.
Word of caution: taking on a position in SQQQ can lead to substantial losses. Only use SQQQ if you are familiar with how the security works.
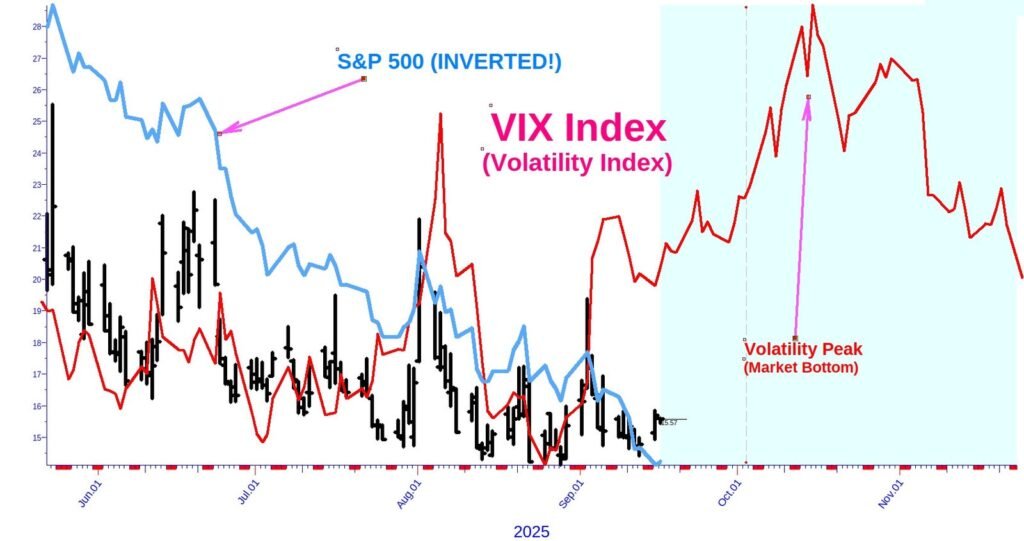
Chart 2 is the VIX Index – otherwise known as the “fear gauge”. It measures volatility in the market. When the VIX reaches an extreme reading to the upside, it typically indicates a market bottom. The S&P 500 flipped on its head is displayed as a light blue line in Chart 2. As one can see, the VIX reading has been very low as of late, and the S&P has been at all-time highs.
The overarching message here is that traders and investors should be on alert for volatility and weakness in the Nasdaq into the 1st week of October. The less the S&P and Nasdaq fall into October, the more bullish the signal for Q4 2025.
Charts expand upon click.