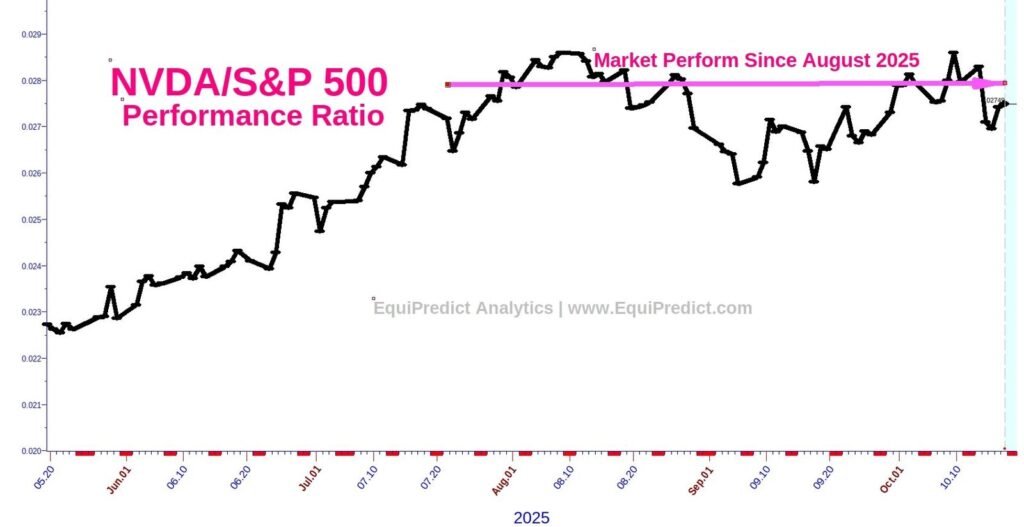
The charts included here are of the relative performance of Nvidia (Ticker: NVDA) in comparison to the S&P 500.
When the black line is rising, it indicates NVDA is outperforming the S&P 500. Conversely, when the black line is falling, NVDA is under-performing the S&P 500.
Since August of 2025, NVDA has been “market perform”. In other words, the stock price performance has been matching the performance results of the S&P 500 (See Chart 1). If you purchased NVDA stock in August of this year, your results between then and now are nearly the same as if you had purchased an S&P 500 index ETF like the well known SPY ETF (Ticker: SPY).
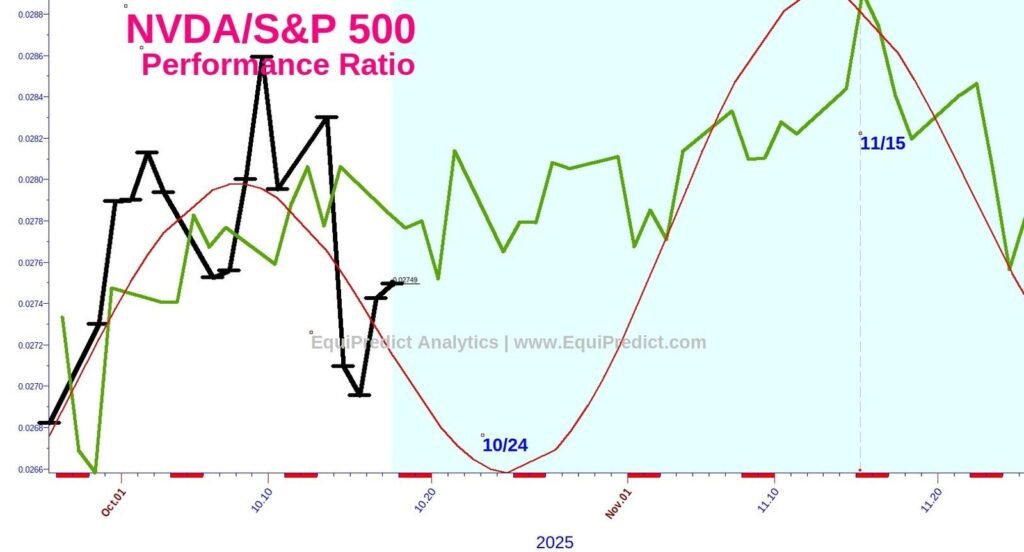
Later this week, look for NVDA to begin to outperform the S&P 500 into mid-November. After mid-November, the relative performance of NVDA is likely to pause or fall behind the S&P 500 into December.
Not shown is a larger cycle that carries the general direction of the relative performance of NVDA higher into Spring 2026, however.
As a reminder, out-performance does not always mean positive returns – a security can outperform an index by way of “falling less than” the index it is being measured against.
Charts expand upon click.