The following chart is available only for Pro and Tailored Analytics subscribers.
In forecasting the general stock market, it is prudent to use the Dow Jones Industrial Average given the fact data is available back to 1896.
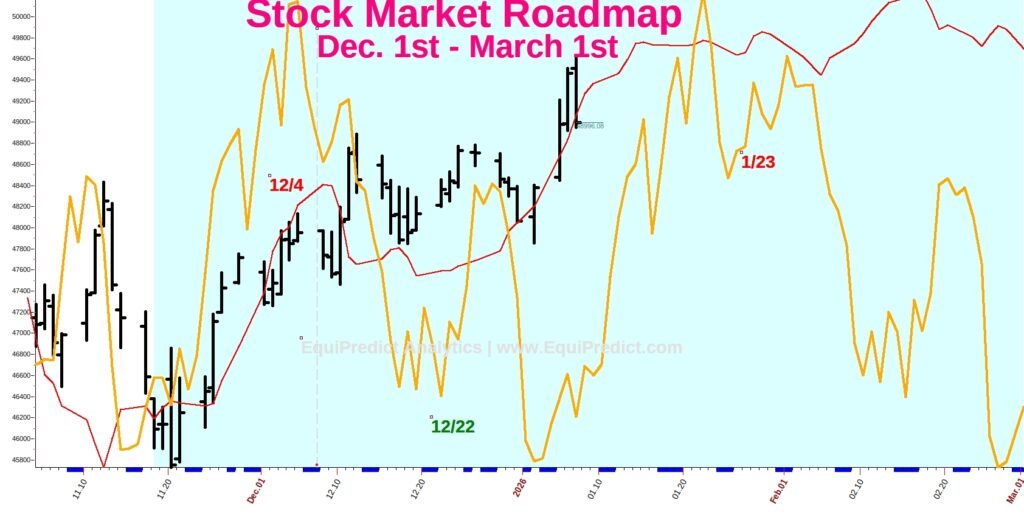
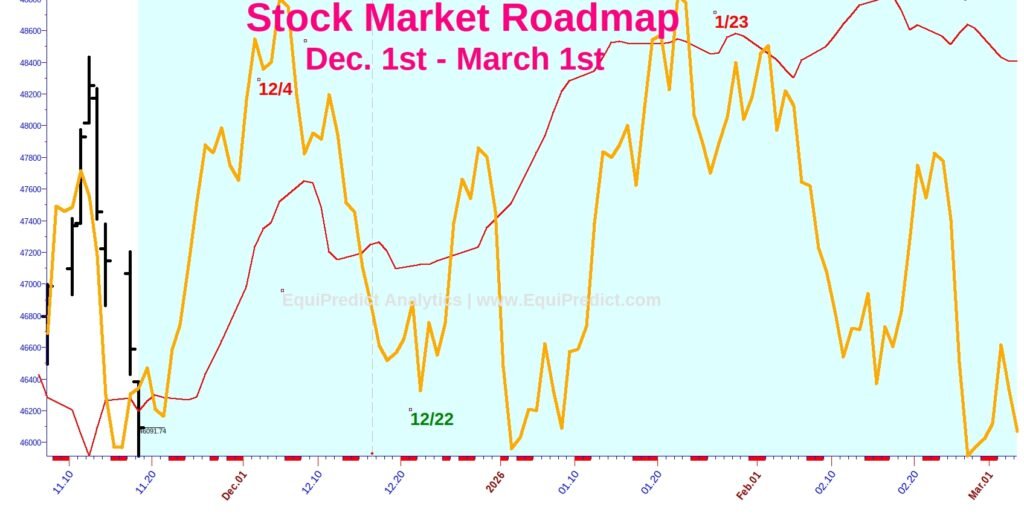
The chart included here is the Dow Jones with a vibrational forecast (orange line) and a directional forecast (red line) overlaid.
The purpose of this chart is to provide general guidance on the behavior of the stock market into March 2026.
We will be publishing the full year 2026 stock market forecast in late December/early January.
Expect weakness or consolidation to set into the markets after the 1st week of December, and a brief “Santa Claus rally” into January. From there, the next “risk off” period appears to be late January into February. NOTE: Dates marked on calendar should be interpreted as reference points only – not precise change-in-trend (CIT) dates.
Chart expands upon click.
As always, we will plan to publish the results below after forecast expiration – in this case 3/1/26.
1/8/26 Update: Forecast remains unaltered. Price action only has been updated.