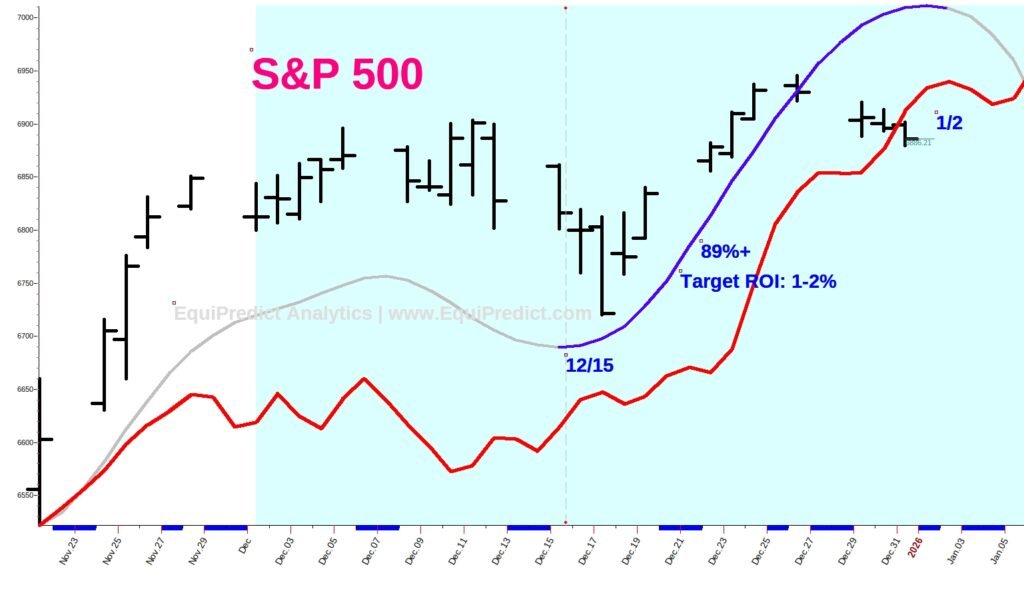
The chart included here is for those who are shorter term traders and investors interested in taking advantage of a potential “Santa Claus Rally” this year.
The Blue Wave forecast shown carries with it an 89%+ probability of a positive outcome. The Blue Wave also aligns with our red wave forecast model adding to the likelihood the forecast will unfold as displayed on the chart.
Although the rally is likely to be minimal, for those who use leverage, the gains can be of meaningful substance within a relatively short period of time.
Reminder: the Blue Wave forecasts are calendar-tied only and are not associated with volatility or price action. The red wave forecast is a “carrying” forecast (bias forecast) that brings price-action along a likely track to its termination.
Chart expands upon click
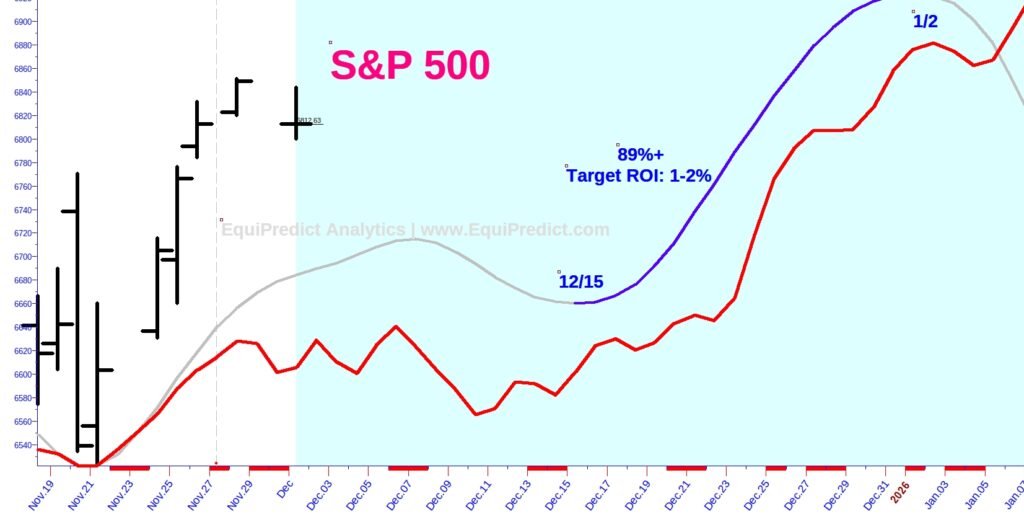
Santa Rally Results, Published 12/31/25: