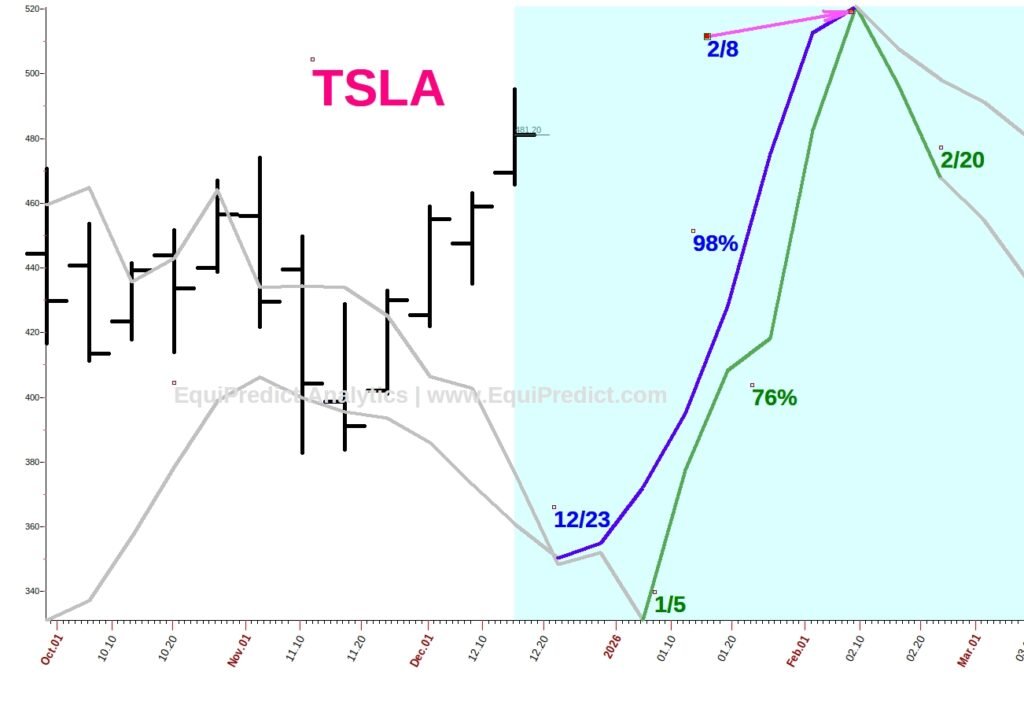
The following chart is of Tesla Inc. (Ticker: TSLA).
Two forecasts are overlaid – a 98% Blue Wave and a 76% Green Wave forecast. The “agreement” between the two forecasts gives way to a higher probability the foretasted bullish bias will play out as anticipated.
As a reminder, the forecasts do not provide insight into the magnitude of the move expected; only the underlying bias of the price behavior.
Chart expands upon click. To preserve the integrity of the work, the full forecast chart, probability structure, and projected bias remain available exclusively to subscribers.
Get the Free Monthly Sentiment Outlook
Stay ahead of market tone with our free monthly sentiment forecast for the Dow Jones, S&P 500, and Nasdaq. Delivered by email before each new month begins. Available for a limited time as we expand our forecasting coverage.
Get This Month’s Sentiment Forecast FreeNo credit card required • Unsubscribe anytime