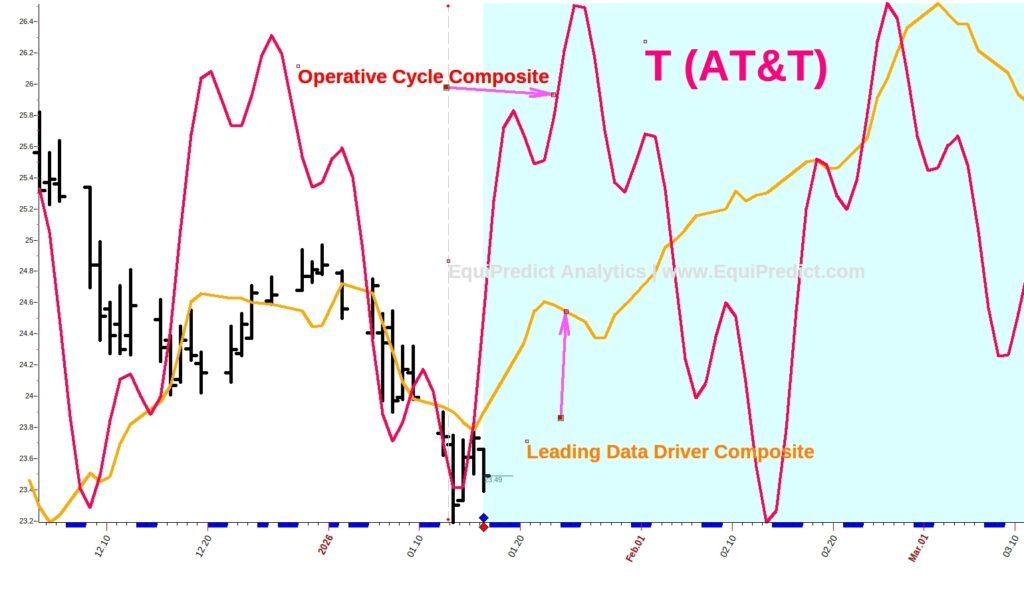
The chart below is of AT&T stock (Ticker: T).
The stock has been under bearish pressure since August of 2025 but price action has entered into a “value zone” between a rising 18 and rising 40 month moving average on the monthly charts.
A blend of operative Red Wave cycles and a composite of leading data drivers is pointing to a short term rally setting in soon.
Chart expands upon click. You must be logged-in to view the full forecast chart.