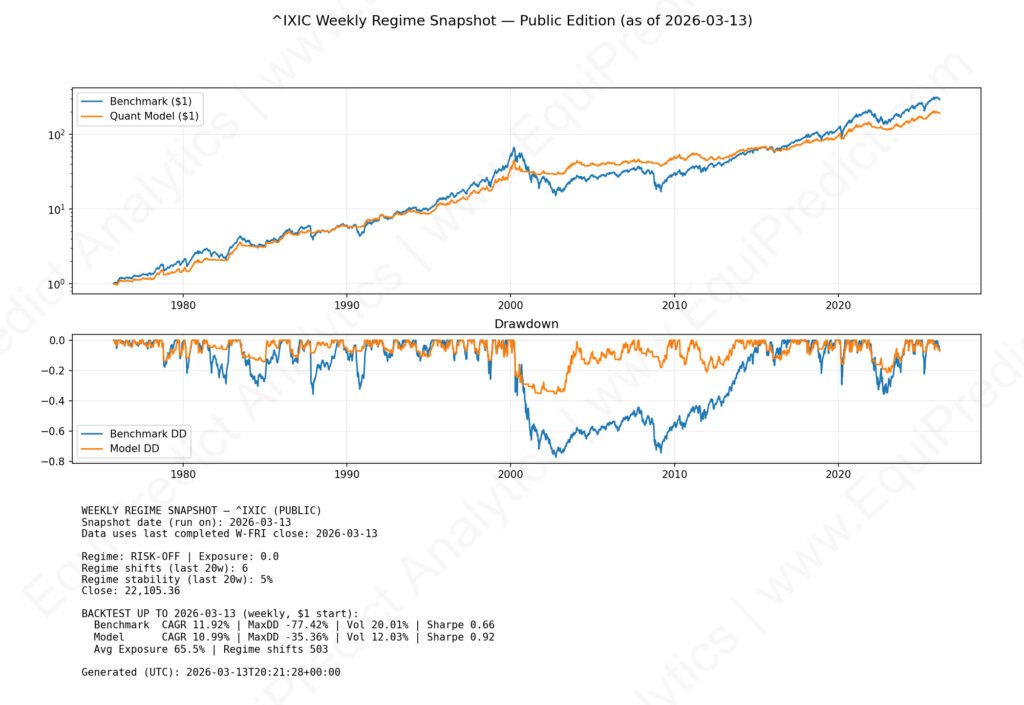
This is a weekly snapshot showing an objective weekly trend model applied to the Nasdaq using long-term historical data for those interested in broader market regime context.
The purpose of these charts is to provide transparency into one of the structural risk lenses that can complement the EquiPredict probabilistic forecasting.
This is not intended to replace forecasts or serve as a standalone trading signal.
Regime classifications (Risk-On, Transition, Risk-Off) reflect general exposure posture rather than short-term market timing.
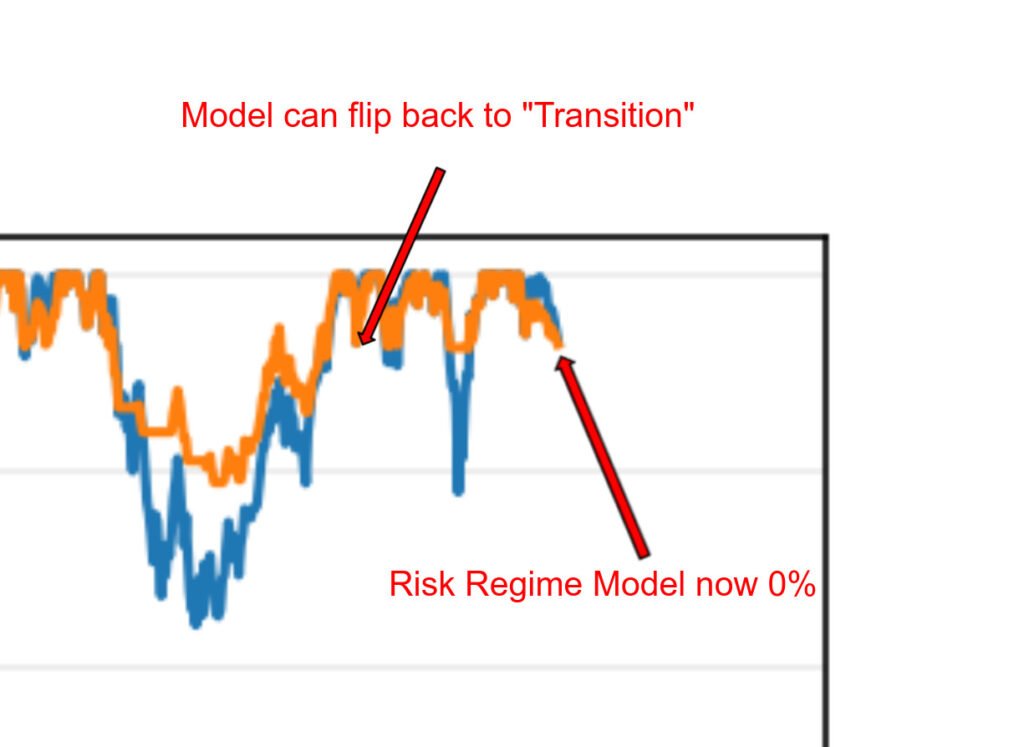
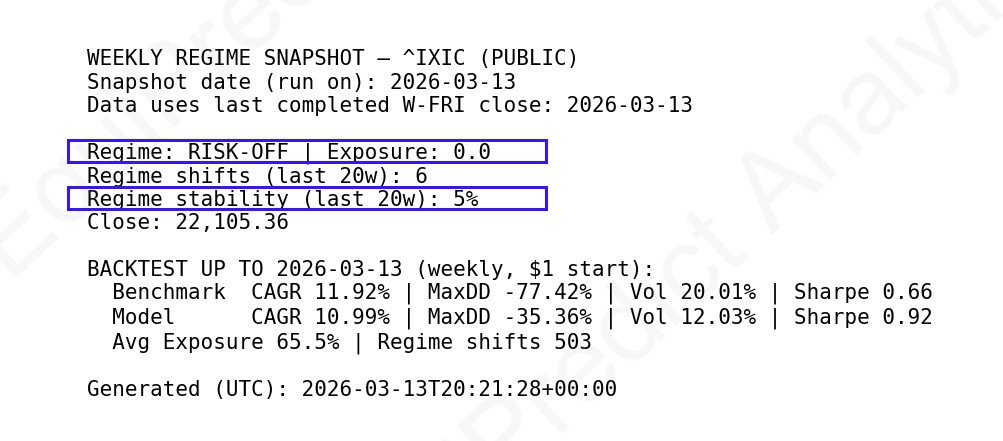
Current risk regime: Now “Risk Off” (0% exposure)
Regime stability: 5% (low stability due to recent flip)
More information about the significance of a flip to “Risk Off” is found at the bottom of this article.
This snapshot is shared publicly for educational and transparency purposes.
Reports expand upon click.
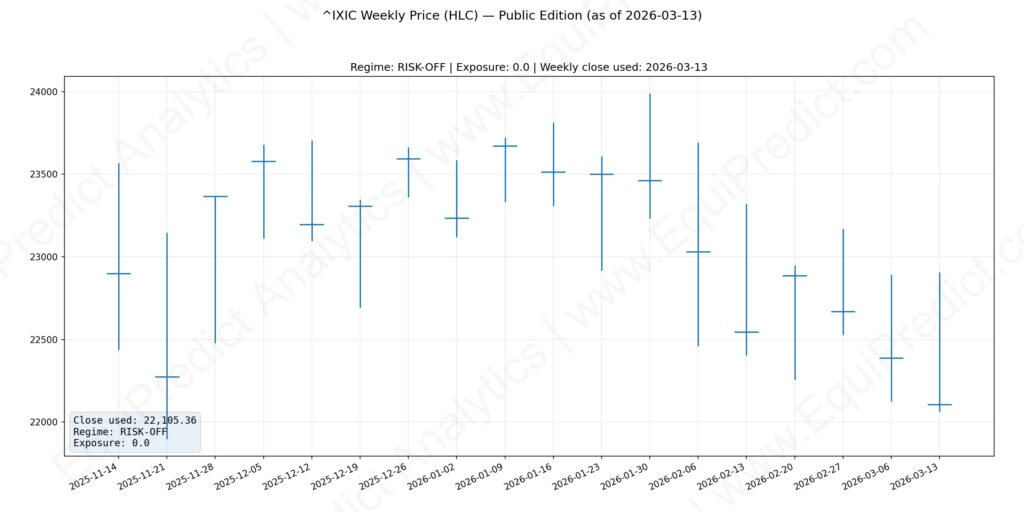
Weekly Nasdaq HLC (High Low Close) chart:
What does “Risk Off” mean?
A flip to “risk off” in the model indicates a recommended exposure level for the Nasdaq and QQQ.
A change to risk off does not indicate a ‘panic sell’ situation, and is merely a recommendation to stand aside and wait for the next risk regime change.
As shown on the chart below, it is possible for the risk model to flip back to “Transition” within a week.