Goldman Sachs (Ticker: GS) has been an outperformer of the stock market since mid-March 2026. The stock is also a leader in its peer group. For those newer to trading and investing, it’s always a good idea to periodically check in on the absolute and relative performance of major banks and investment institutions like Goldman Sachs.
These large institutions are another excellent ‘bellwether’ for the economy as a whole. If banking and investment institutions are doing well, generally speaking, the stock market will remain in a bullish or price-supportive state.
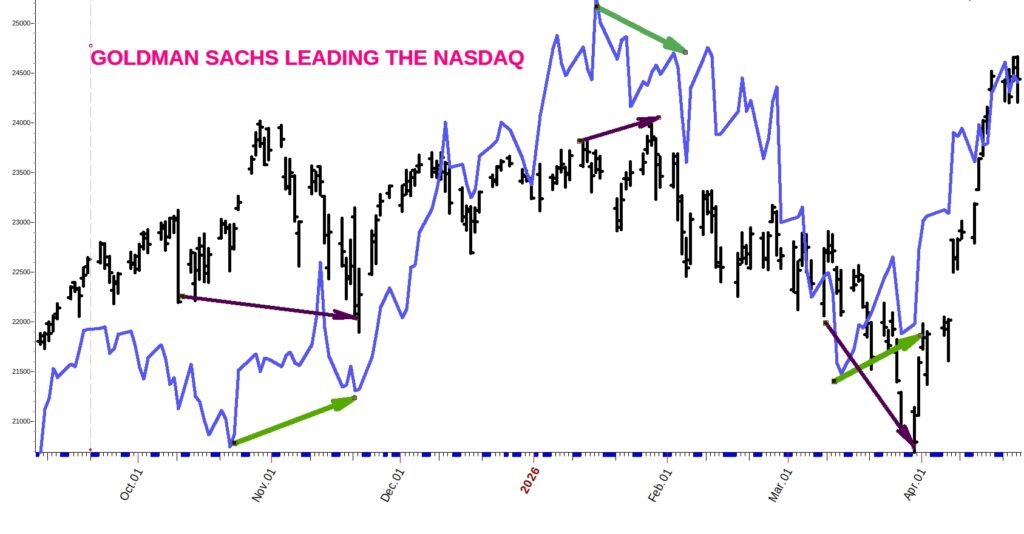
An example of how to monitor the price action of institutions like Goldman Sachs compared to a growth index like the Nasdaq has been provided below. The blue line is the price action of GS. The green arrows highlight price-divergences from what Goldman Sach’s price action was doing compared to that of the Nasdaq. In each example here from late 2025 and early 2026, Goldman Sach’s price action provided a strong bullish or bearish signal in advance of market turns.
Chart expands upon click
The Forecast
The below chart is a weekly chart of GS with a red wave forecast providing guidance for when traders and investors should be on the look-out for bearishness (or consolidation) and bullish bias into 2027.
A Blue Wave signal is also in agreement with the red wave forecast. The Blue Wave shown carries with it an 88% probability and target ROI of 12-15% over the given time frame.
Free QQQ Timing Guide: