The Red Wave forecast model has been upgraded to improve timing precision and visual analysis, as well as better align with underlying economic cycle data.
At its core, the Red Wave identifies calendar-based inflection points.
These are periods where market conditions statistically favor:
- Accumulation (troughs – be a “buyer”)
- Risk reduction (peaks – be more defensive/adjust risk management measures)
While no cycle is perfect and inversions do occur, this framework helps position traders and investors ahead of shifts.
Introducing: Economic Driver Probability (EDP) Zones
We are now layering in Economic Driver Probability (EDP) Zones. This is a new system that quantifies the likelihood of meaningful directional movement within specific time windows, similar to Blue Wave forecasts. EPD Zones are displayed as GREEN ARROWS and are often shorter time-frame windows.
Only zones with 85%+ probability will be shown going forward.
These zones will highlight:
Periods where multiple economic and cyclical drivers are aligned.
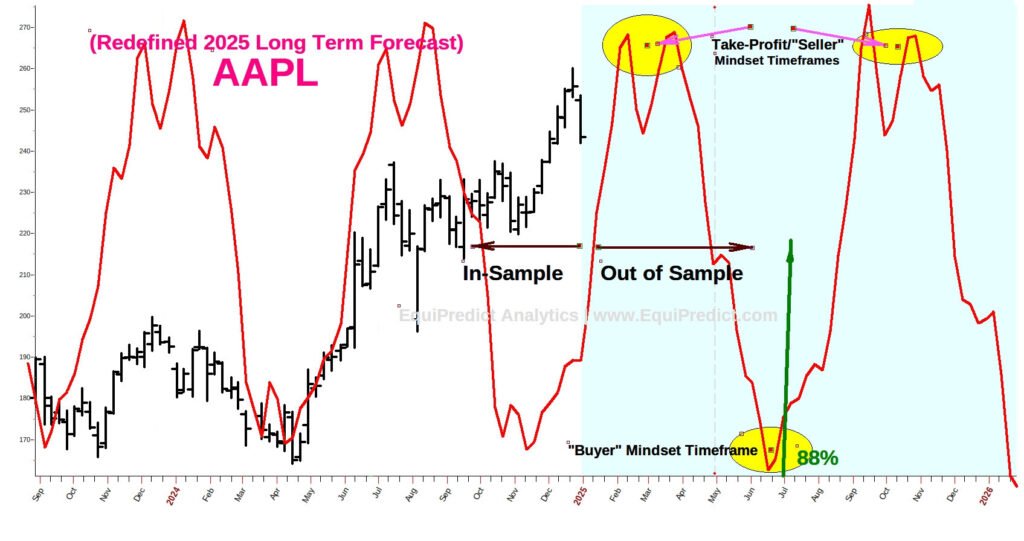
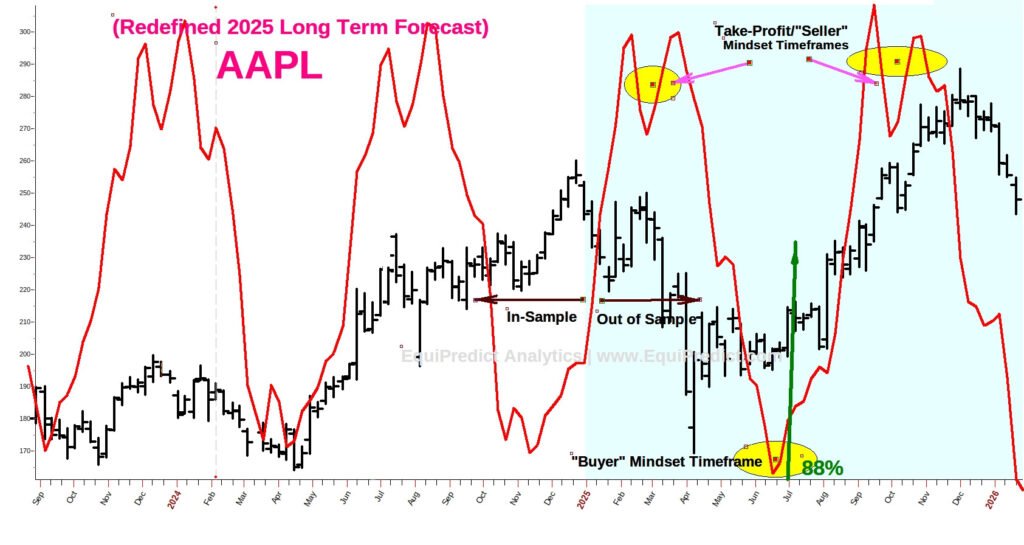
Charts 1 and 2 below show how:
- The improved Red Wave model tracks cyclical structure
- EDP Zones identify high-probability windows with precision
The following 2025 AAPL forecast used data up to 12/31/2024.
(Charts expand upon click)
For Members
The full, updated 2026 forecast using data up to 12/31/25 reveals:
- The complete Red Wave bias into 2027 and timing windows
- Two high-probability EDP Zones (88%+ and 92%+) ahead
Chart 3 (Members Only):