EquiPredict members have access to a ‘Monthly Sector Profile‘ page within the member dashboard.
The sector performance readings found on the sector profile page are updated monthly, and shed light on Wall Street’s capital allocations across the major stock market sectors like Technology, Consumer Discretionary, Consumer Staples, Energy, etc…
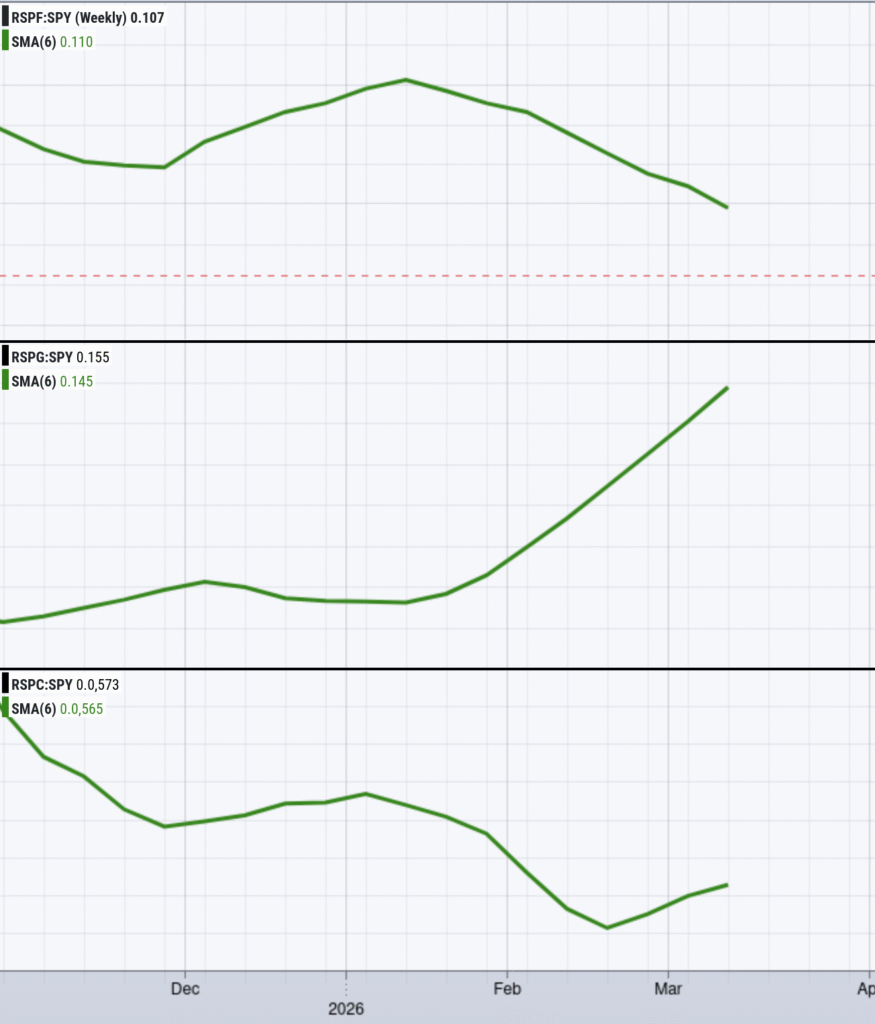
In order to make viewing and interpretation of the sector performance readings easier, the performance reading charts will be adjusted (new look below).
9 sectors will be covered starting in April – both capitalization weighted and equal weighted. Materials and real estate will no longer be specifically covered.
As a reminder, these are rear-looking performance readings and can help investors interpret Wall Street’s institutional risk appetite when viewed holistically. These are not forecasts, and are provided as data to help members manage risk as well as compliment the EquiPredict forecasts.
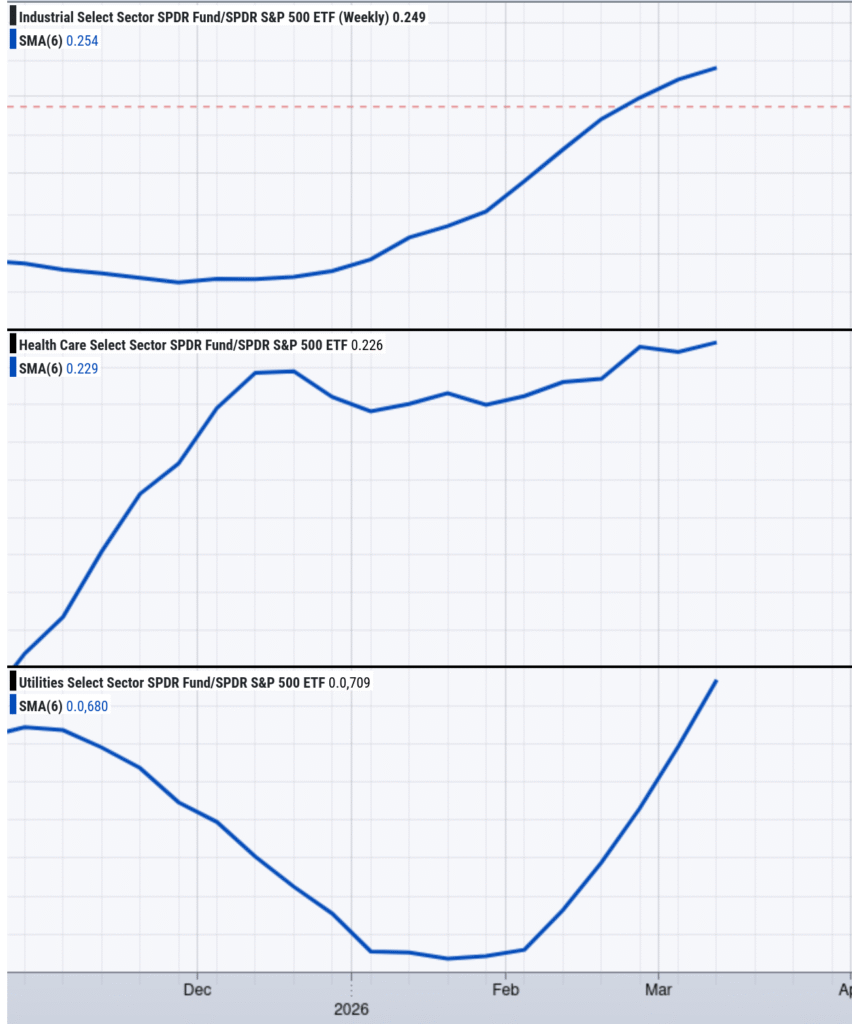
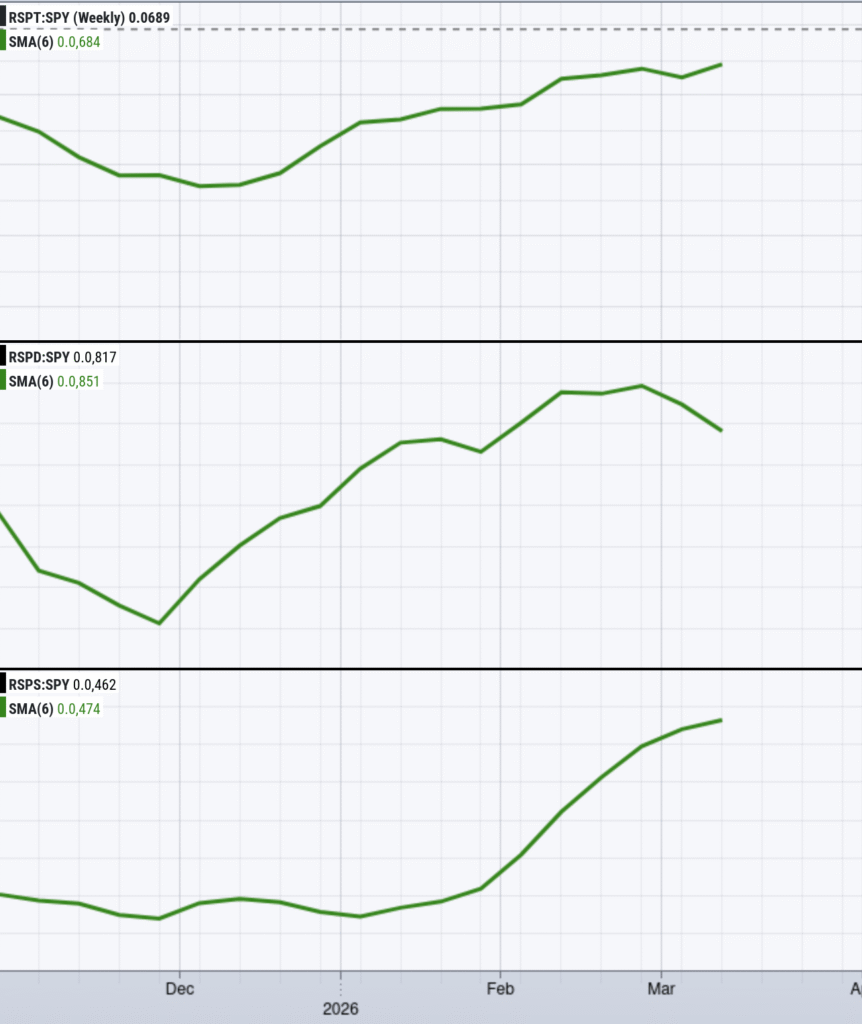
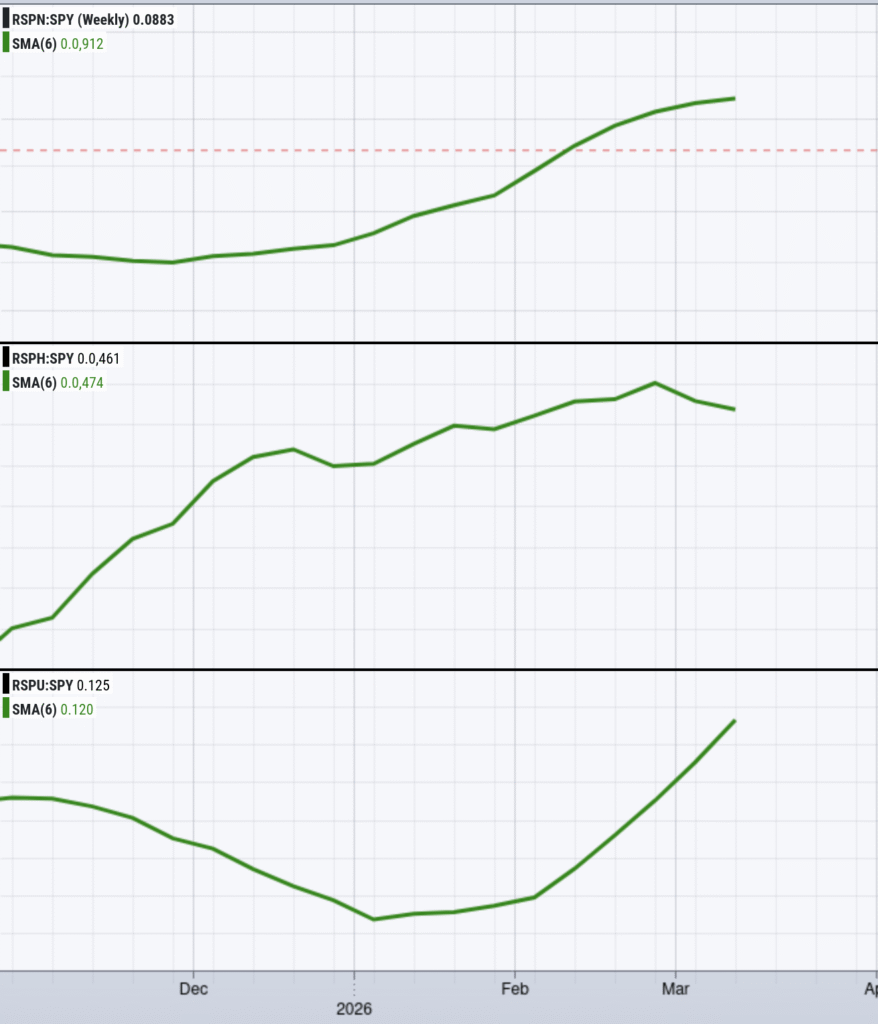
When the sector performance line is rising, it indicates the sector is OUTPERFORMING the S&P 500. Conversely, when the line is falling, it indicates the given sector is UNDERPERFORMING the S&P 500.
Click each chart to expand.
Capitalization Weighted (Cap-Weighted) Performance Charts:
- Technology
- Consumer Discretionary
- Consumer Staples
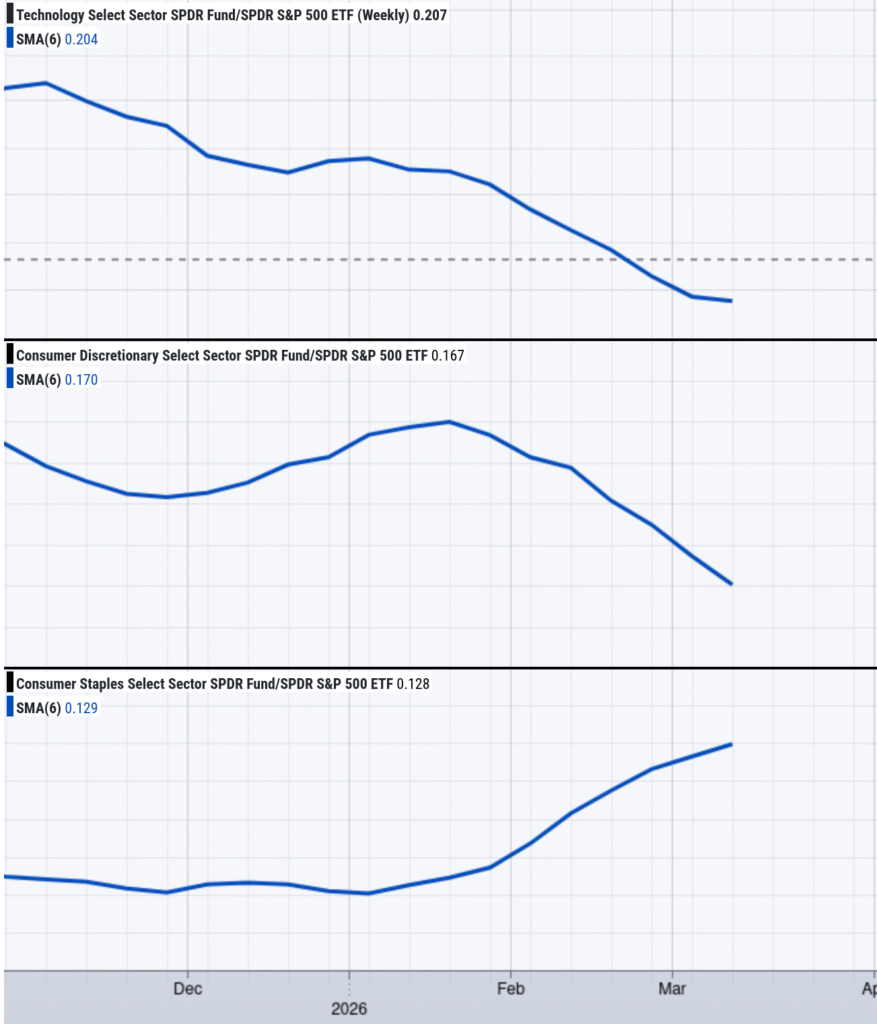
- Industrials
- Healthcare
- Utilities
- Financials
- Energy
- Communications
Equal Weighted Performance Charts:
- Technology
- Consumer Discretionary
- Consumer Staples
- Industrials
- Healthcare
- Utilities
- Financials
- Energy
- Communications
The new look will take effect starting with the April Monthly Sector Profile Update.