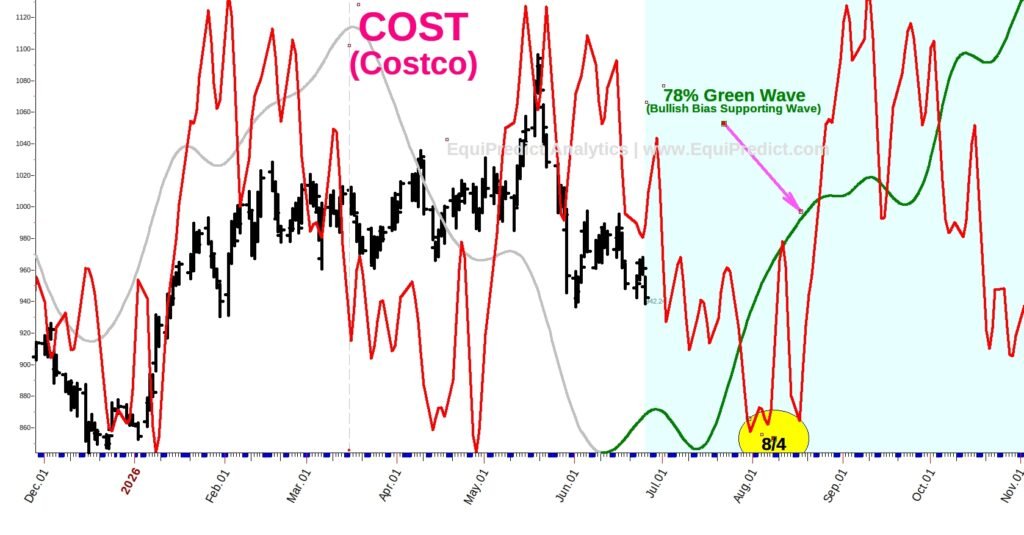
The below chart is a daily chart of of Costco Corp (Ticker: COST).
Costco is one of the larger 100+ holdings inside the QQQ ETF.
Overlaid on COST is our red wave model providing guidance on where to be ‘bullish’ on the stock, and where to look for consolidation (sideways price movement) or even be ‘bearish’ on the stock (a seller of the stock).
Also included is our Green Wave model with a 78% probability attached. The Green Wave model is completely exogenous to the stock’s price action itself as well as the red wave model. Our green and blue wave models add supporting evidence when they are ‘in agreement’ with red wave models.
According to the forecast, the next bullish-bias timeframe in Costco’s stock should commence in early August.
Chart expands upon click.
Free QQQ Timing Guide: