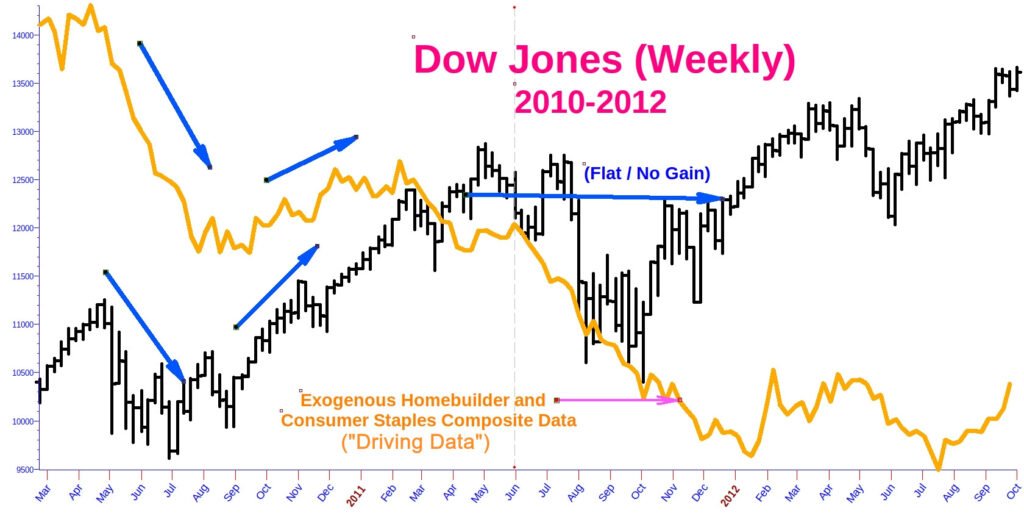
The series of charts here is composite data blending information from Homebuilder stocks and Consumer Staples stocks from 2010 to 2025.
We continually analyze the three major market indices from a variety of distinct angles to better equip our readers and subscribers with actionable risk-management insights across both short- and long-term timeframes..
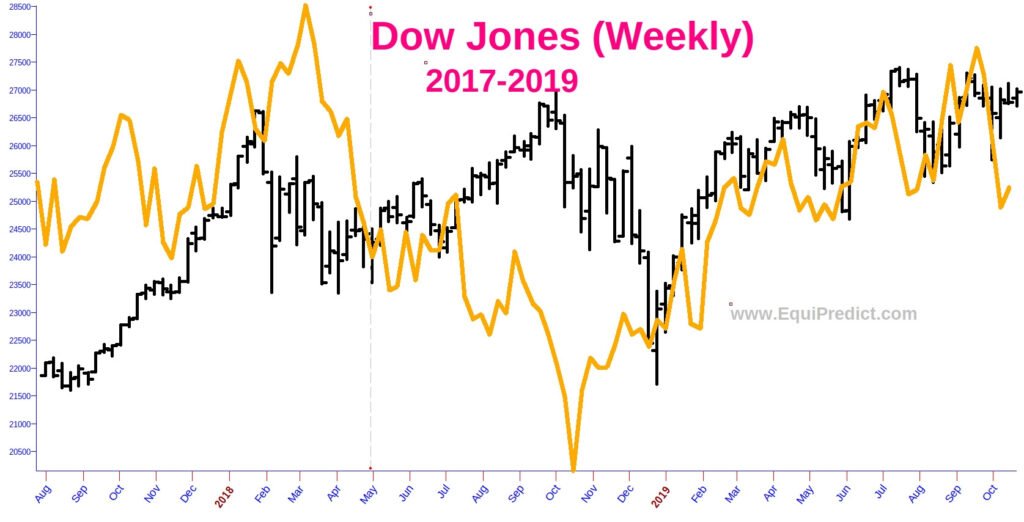
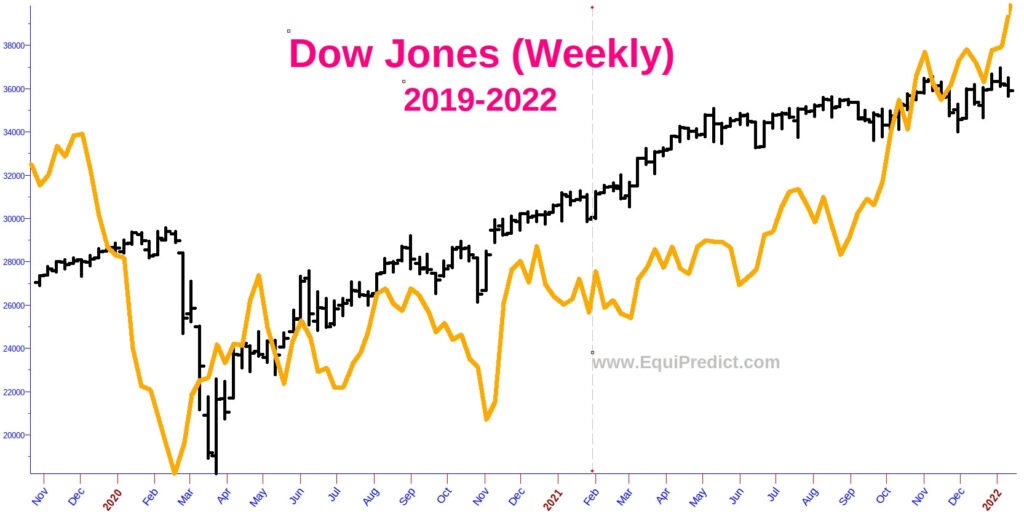
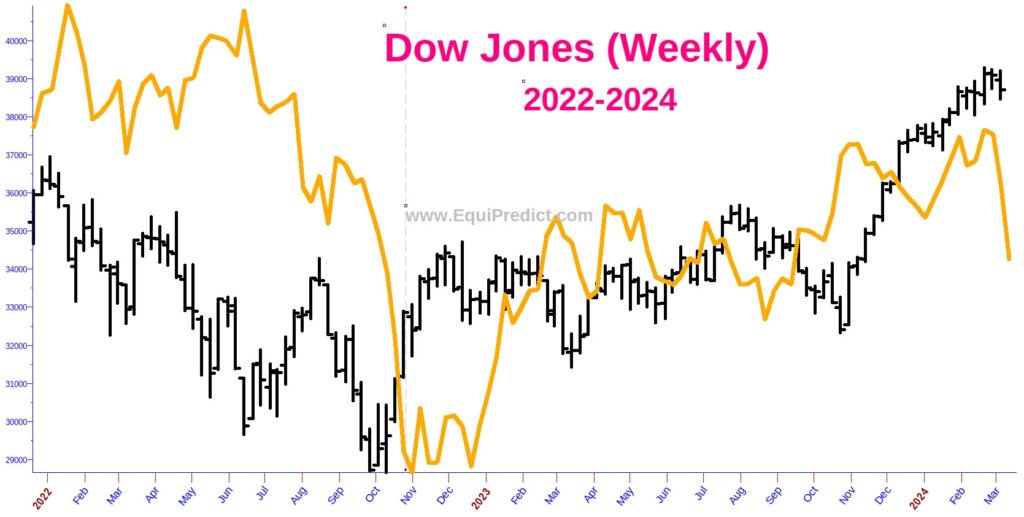
The data presented here is best understood as a driving force behind trends in the Dow Jones, instead of “turn-by-turn” forecasting data.
Each chart expands upon click
2010-2012:
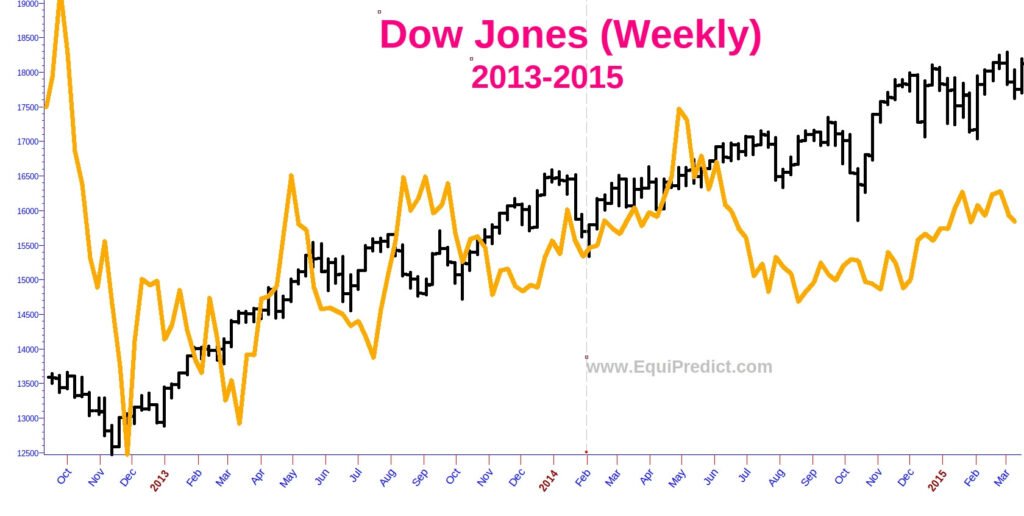
2013-2015:
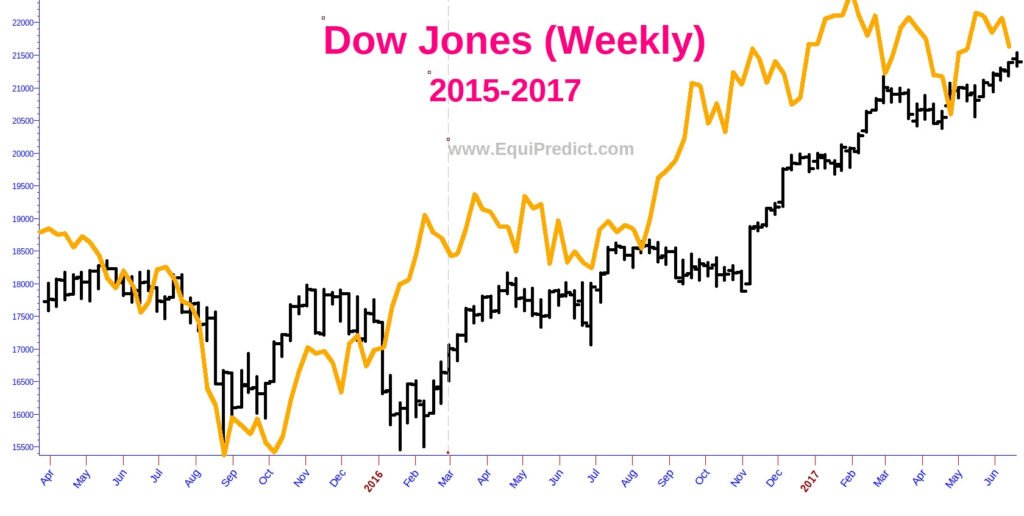
2015-2017:
2017-2019:
2019-2022:
2022-2024:
2025-2026 (Subscriber Content – Log In HERE to view forecast):
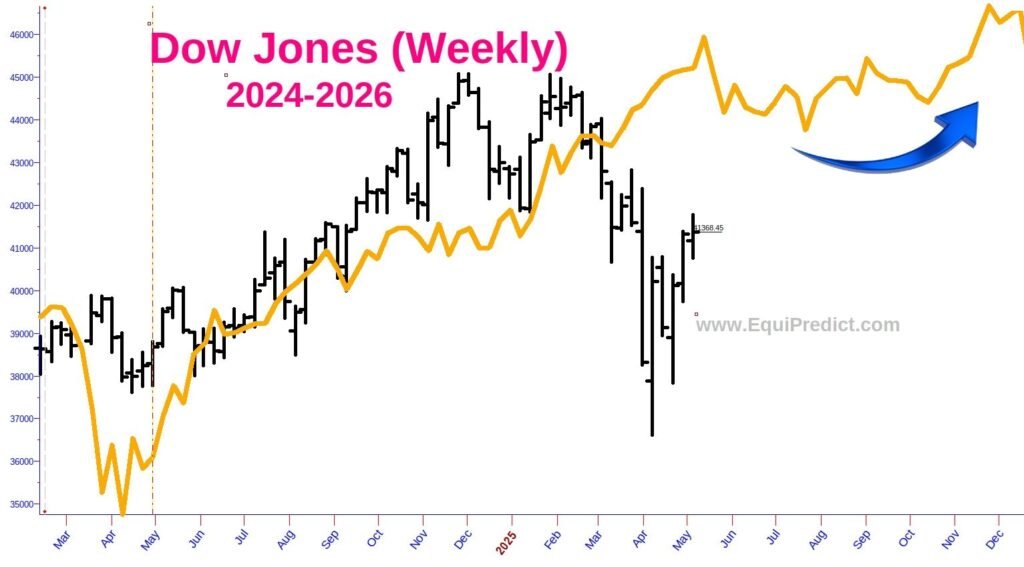
2024-2026:
Although the Dow has seen notable pressure and a subsequent rebound since early 2025 not precisely forecasted by the exogenous data, the “driving” homebuilder/staples data is pointing to the Dow Jones (and the general stock market) finishing the year in bullish form. In other words, be cautious being too bearish at this time. However, as stated previously, the data sets for 2026 are looking concerning for the bulls.