The first chart shown below is how our Red Wave model for the Dow Jones Industrial Average has been tracking the Dow’s price action over time.
We are now at or near a current cycle high.
For those who are swing-trade style traders, or focused on weekly and monthly cycles, it is time to exercise short-term risk management measures.
Charts expand upon click.

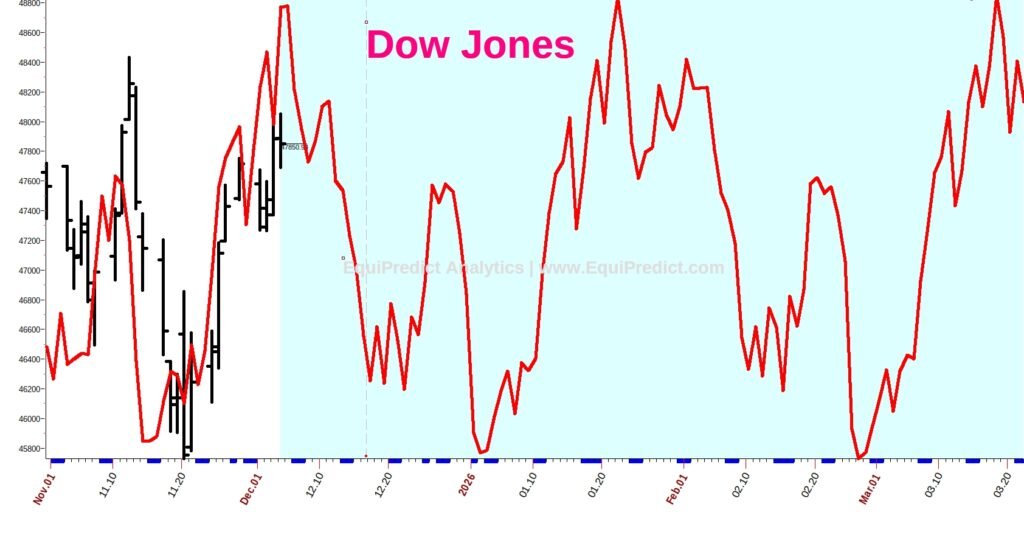
Chart #2 below is the cyclical behavior forecast for the Dow Jones Industrial Average into March 2026: