The weekly Nasdaq risk regime snapshot has three core components market participants should be primarily focused on when reading it:
- The regime classification
- The exposure
- The regime stability reading
Everything else in the report supports these three elements.
The model is not designed to “outperform” the Nasdaq. Attempting to optimize for outperformance is how curve-fitting happens. The objective for longer-term investors is to manage and reduce risk. The market takes care of the rest over time.
The Regime Classification
This simply states whether the strategy is currently in:
- Risk On
- Transition
- Risk Off
This classification is the foundation of the model. It reflects the structure of the market, not predictions about what the market will do next.
The textual regime reading then flows directly into a quantifiable figure: exposure.
The Exposure
Exposure translates risk into a percentage.
- 1.0 → 100% invested (Risk On)
- 0.5 → 50% invested (Transition)
- 0.0 → 0% invested (Risk Off)
This is not meant to capture tops and bottoms.
Will you still experience drawdowns while in Transition? Yes.
Will you miss the exact bottom and some early upside? Yes.
That is by design.
The strategy is focused on minimizing large drawdowns and managing risk over time, not on precision timing or chasing maximum returns.
Over long periods, the model has historically produced significantly lower peak drawdowns than a buy-and-hold Nasdaq approach while still participating in major advances. It is not optimized for “max return,” and it is not curve-fitted to look attractive.
The Regime Stability Reading
This is the piece that completes the interpretation of the first two components.
Regime stability measures how consistently the market has held the same regime over roughly the last 20 weeks. Think of it as a “trend quality” gauge.
| Stability | Meaning | Description |
|---|---|---|
| 0–30% | Choppy / indecisive | Expect flips and shorter signals |
| 30–60% | Mixed | Some trend, but rotation and noise remain |
| 60–80% | Strong trend | Regime holding direction; signals persist |
| 80–100% | Very stable | Clear sustained market structure |
Stability is not a performance metric and it is not a confidence score. It simply describes how orderly — or disorderly — the market environment has been.
Low stability means the market has been rotating and regimes have been changing more frequently. High stability means the market structure has been consistent and directional.
Putting the Snapshot Together
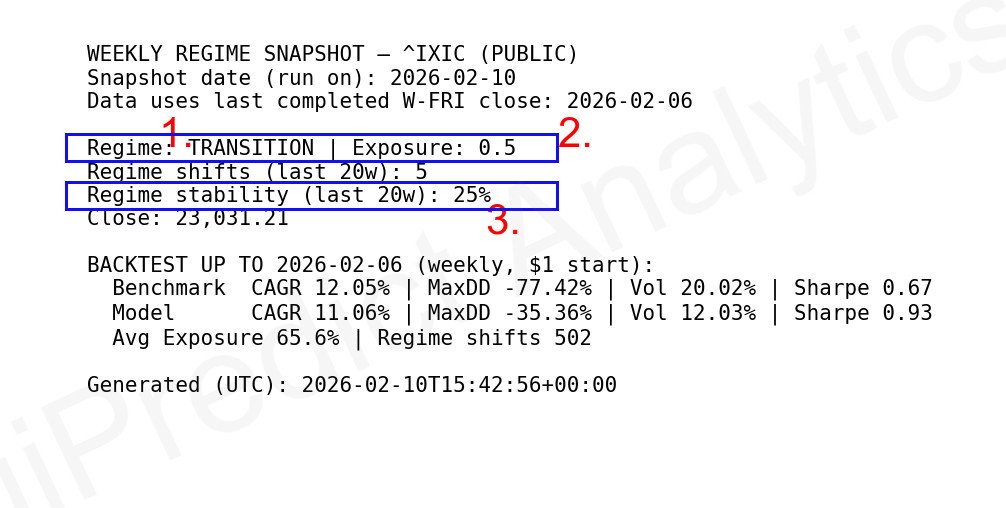
Using last week’s Nasdaq closing data (Friday, Feb. 6, 2026), the risk regime snapshot can be summarized as follows:
- The Nasdaq is in Transition
- Recommended exposure is 0.5
- Stability is low (~25%)
This combination points to a market that is not in a confirmed risk-on trend and has recently been unstable and prone to flips.
In this type of environment, the model favors partial exposure and greater caution rather than full commitment.
The goal of the strategy is not to predict the next move. The goal is to stay aligned with risk conditions as they evolve over time.