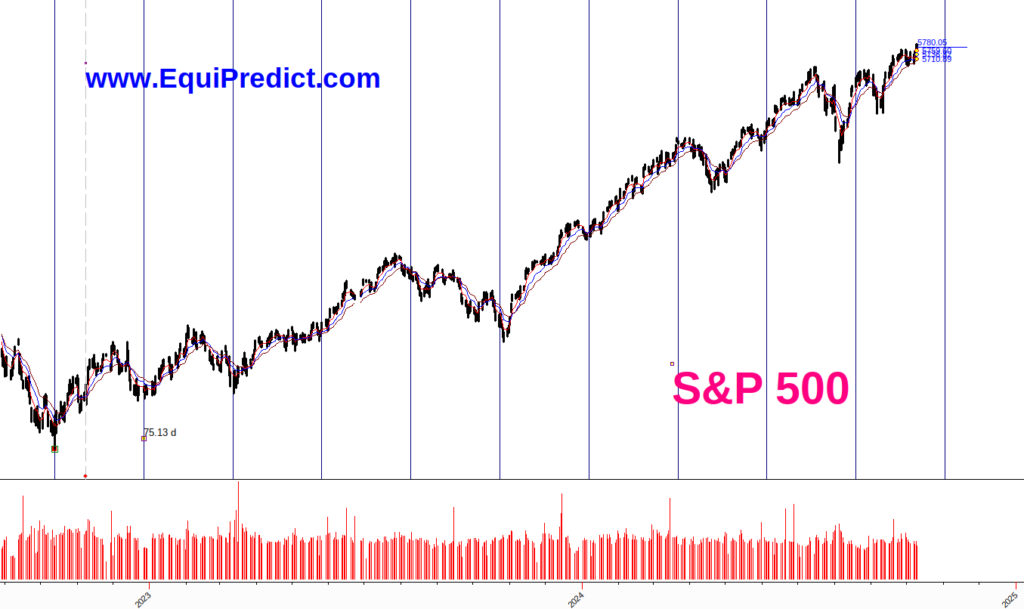
Since the 2022 bottom, there’s been a shift in the length of the cycle present in the S&P 500 (Current chart here).
In the past, the cycle has existed primarily as a 66-67 day cycle. However, something has changed in the market and we are now seeing a 75 day cycle.
Using the chart above as an example, all of these cycle starts (black lines) have been profitable or break-even, except for one: the March 2024 cycle.
This occurrence of high correlation is statistically significant and should be minded by active market participants.
We are nearing a cycle low (cycle start) at the end of October.
The concerning point here, however, is that half-way through the next cycle (12/9) is a particular moment in time which aligns with multiple EquiPredict forecasts pointing to greater weakness in stocks.
