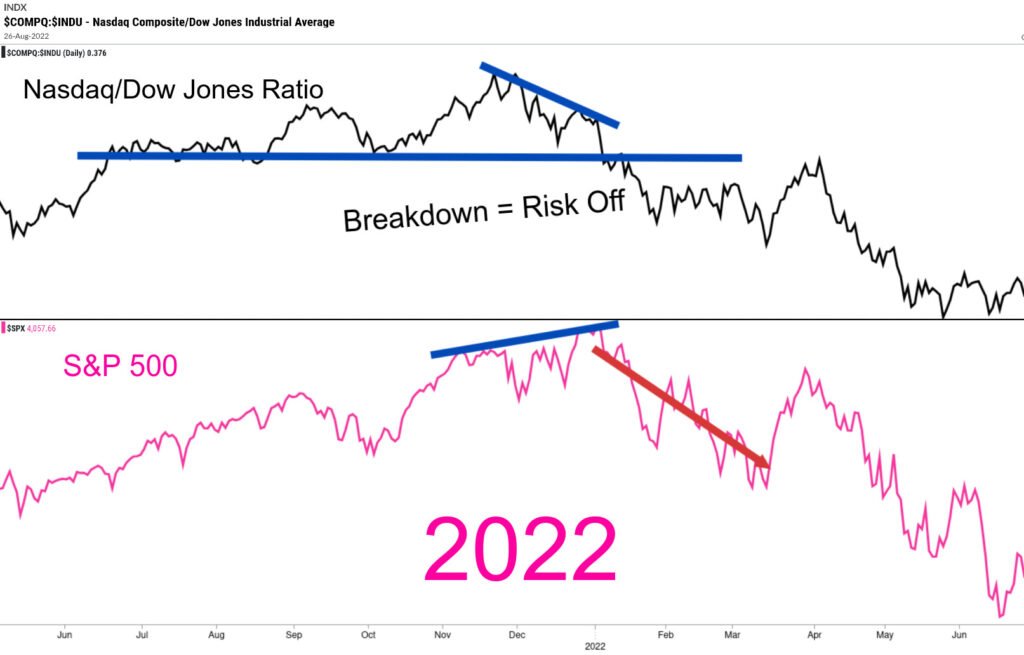
Chart #1 has two panels. The top panel is the performance ratio of the Nasdaq (think: Risk On) and the Dow Jones (think: Risk Off). When the black line is rising, the Nasdaq is outperforming the Dow Jones. The inverse is true when the black line is falling.
EquiPredict Analytics is not a technical analysis service, but it is prudent to observe market mechanic technical components when conditions warrant a check and combine them with forecast data to gain a better understanding of likely market direction.
The signal in 2022 was clear. Wall Street clearly went full “risk off” at the very start of 2022. Notice how the performance ratio steadily tipped in favor of the Dow (black line fell) and broke below the performance ratio support line.
The S&P 500 followed suit shortly thereafter.
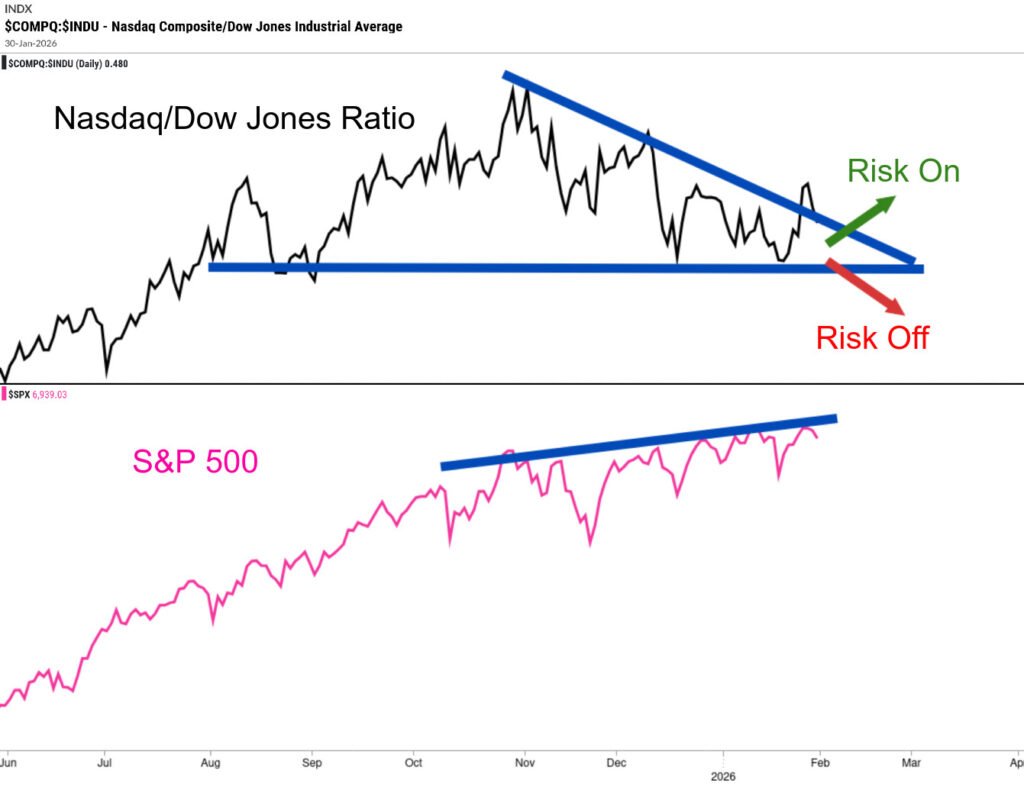
Fast forward to today.
Indicators on Chart #2 are arranged in the same manner. Until the performance ratio breaks to the downside, a sell-off scenario is unlikely.
EquiPredict continues to monitor these charts and members will be alerted to a definitive break to one side or the other should one occur.
Interested in the free EquiPredict QQQ Timing Starter Kit?
The timing guide is a concise framework for understanding timing, cycles, regime shifts, and probability context in the NASDAQ-100.
You can pick it up here: