One of the best ways to “beat the market” is to look for strength – find those equities which are beating the S&P 500.
Too often ‘dip buyers’ think because a stock has fallen, it will soon rebound higher.
More often than not, however, the key rule to investing holds true:
Strength leads to more strength; weakness leads to more weakness.
Morgan Stanley (Ticker: MS) has been a recent out-performer compared to the S&P 500 (See chart 1).
Each chart expands upon click.
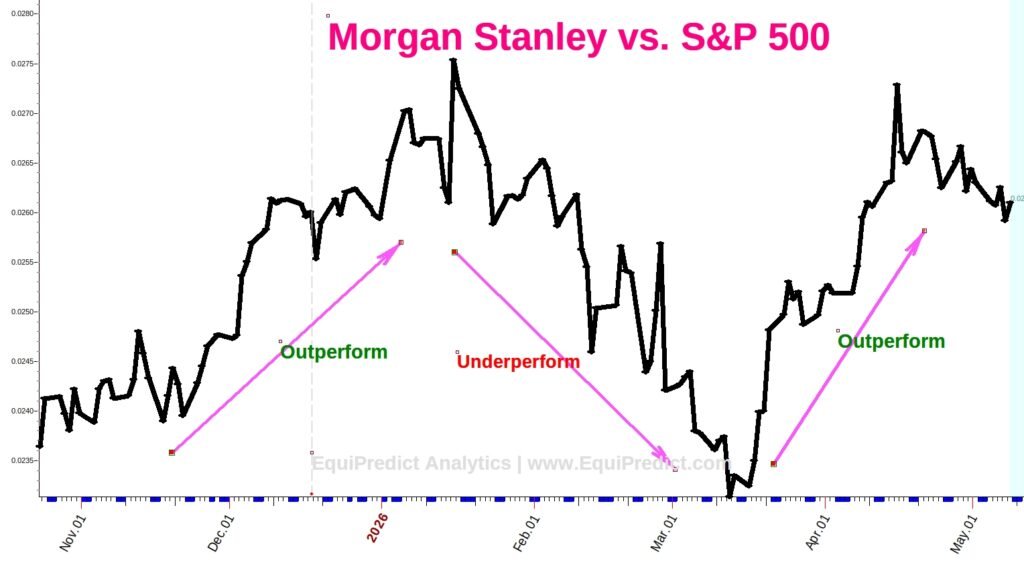
Beyond this market out-performance, of the large cap banking stocks, MS has also been a leader in financial-sector performance. In other words, it is leading its peers in strength.
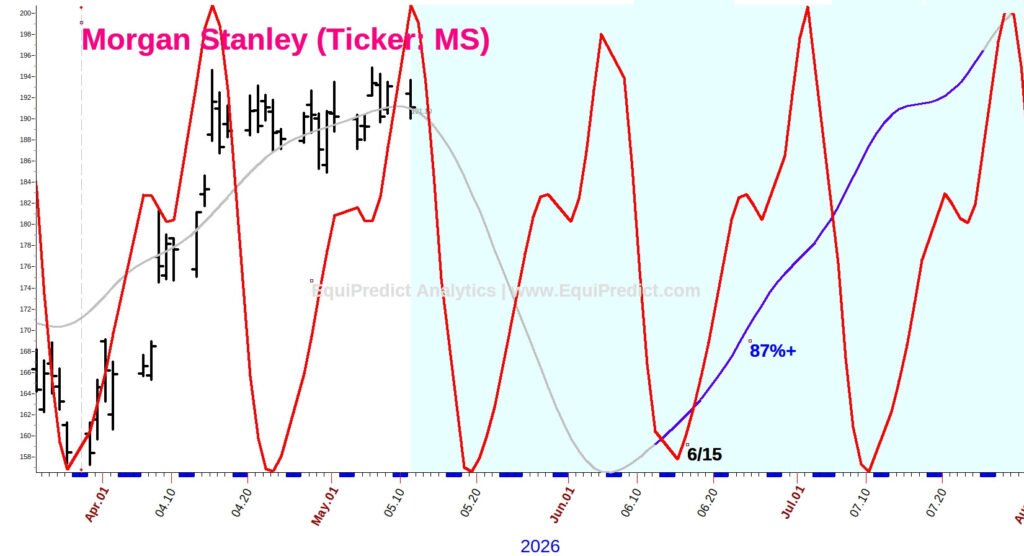
The forecast below (Chart 2) is our red wave cyclical-based forecasting model overlaid on the daily chart of MS as well as a Blue Wave forecast with an 87% probability attached. During the blue wave sections of the forecast, the stock is likely to see bullish bias holding steady through the given red wave cyclical ebbs and flows.
Note: The EquiPredict Analytics forecasting models forecast bias of a stock’s price behavior – not the magnitude of a given move ahead.
Free QQQ Timing Guide: