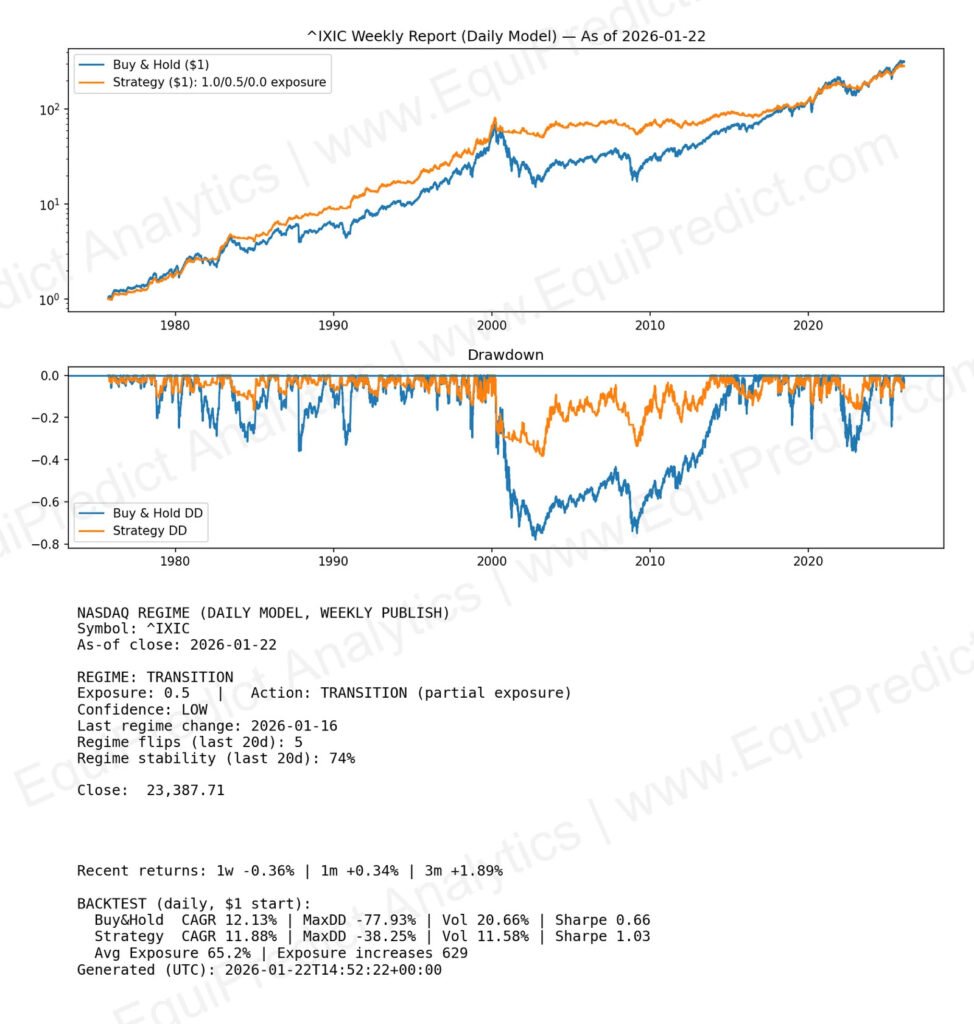
For those interested in broader market regime context, this weekly snapshot shows an objective daily trend model applied to the Nasdaq using long-term historical data.
The purpose of this chart is to provide transparency into one of the structural risk lenses that can complement probabilistic forecasting. This is not intended to replace forecasts or serve as a standalone trading signal.
Regime classifications (Risk-On, Transition, Risk-Off) reflect general exposure posture rather than short-term market timing.
This snapshot is shared publicly for educational and transparency purposes.
Report expands upon click.
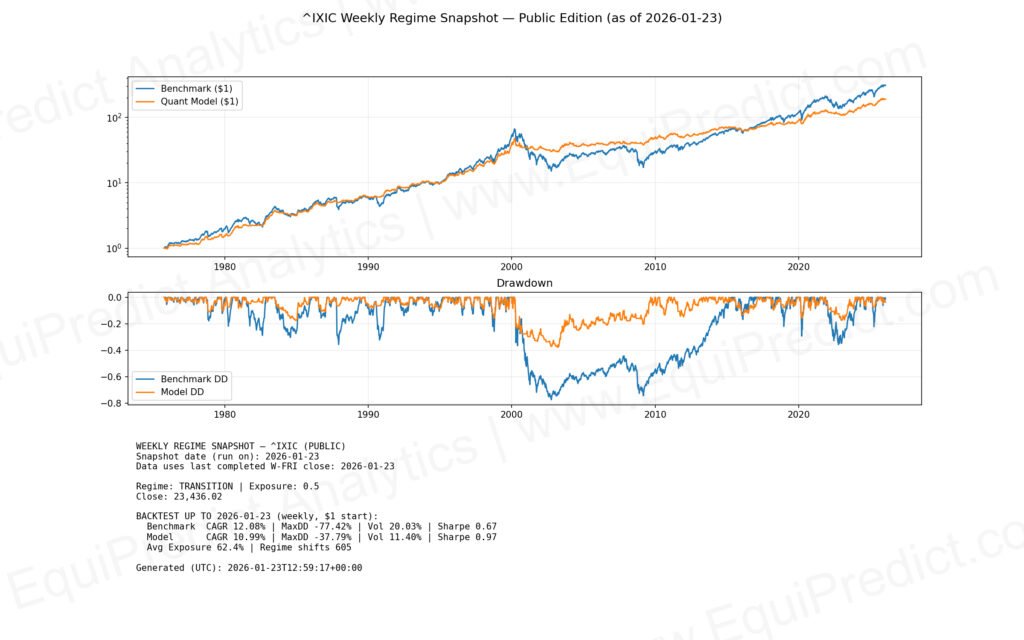
1/23/26 Edit: The below chart uses weekly data only (not daily data as above). At the moment, the weekly regime is still in TRANSITION with moderated exposure as well.