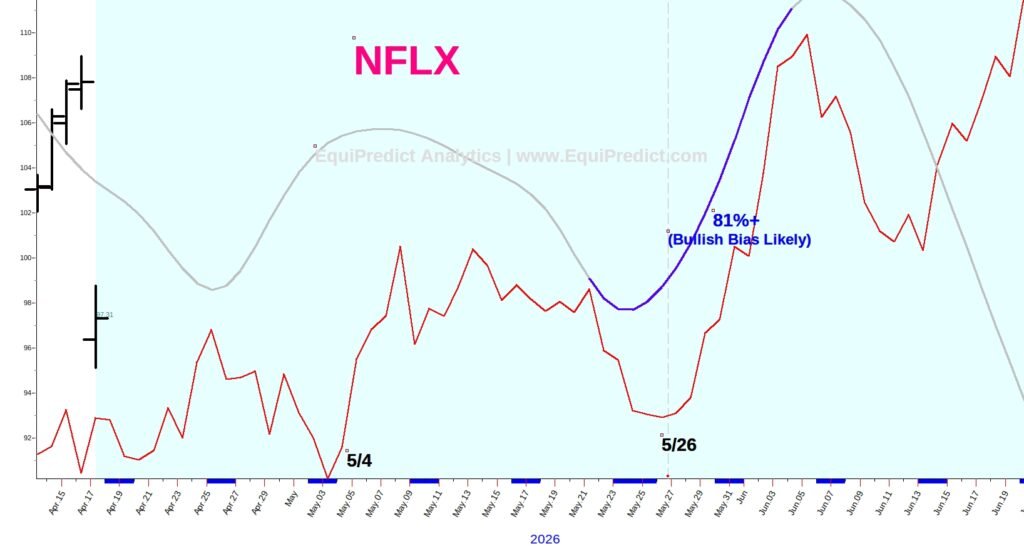
The chart below is a daily chart of Netflix (Ticker: NFLX).
NFLX saw an opening price drop of nearly 10% after an earnings announcement on April 17th.
The stock, however, is likely to remain in bullish mode over the next 2-3 months.
For those looking for a next entry into NFLX, two dates have been marked off on the chart to look for a change in trend. A Blue Wave forecast has also been overlaid on the chart with an 81% probability attached. Blue Wave forecasts add supporting evidence to likely bullish bias (or bearish bias if indicated) over a given period on the calendar. Note: the greyed-out portions of the forecast line should be largely disregarded.
Chart expands upon click.
Free QQQ Timing Guide:
Looking for the QQQ Timing Guide?
Learn how EquiPredict evaluates structure, timing, and probability in the NASDAQ-100 –
without signals, hype, or emotional trading.
Get the Free QQQ Timing Guide
Educational only. No spam. Unsubscribe anytime.