5/22/25 Edit: Blue Wave Forecast results posted.
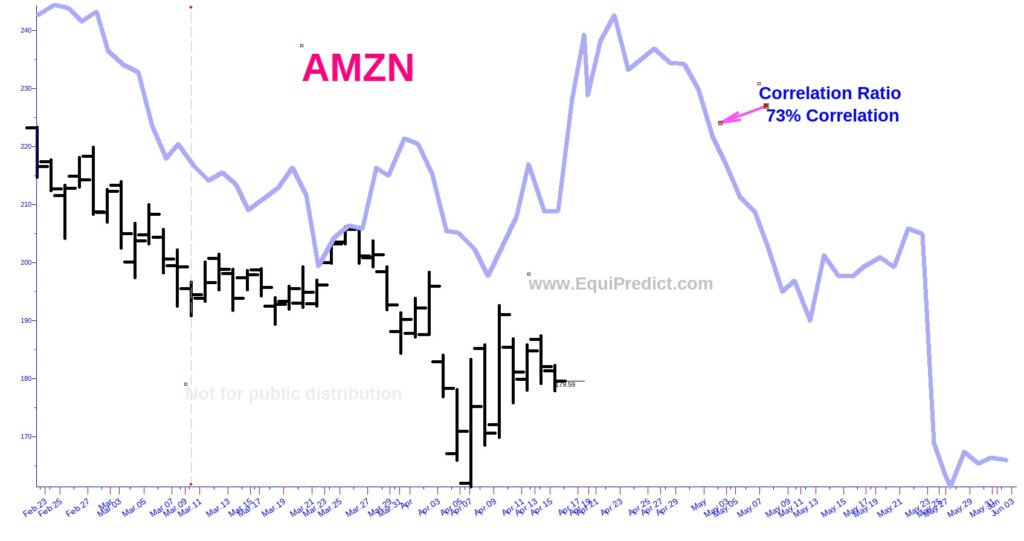
5/16/25 Edit: Correlation chart added on 4/15/25 with light blue line should be disregarded. The 73% correlation is not sufficient. Blue Wave chart is operable, however.
4/15/25 Edit: Correlation chart added to post on 4/15/25
A short-term blue wave forecast with a high probability attached has been uncovered for Amazon.com stock (AMZN).
The blue wave shown indicates bullish bias should be expected in Amazon stock’s price between the dates shown on the chart.
Reminder: forecasts do not indicate magnitude of price action, only underlying bias tied to calendar dates and time-frames.
Chart expands on click.

Also included here now is a correlation forecast that generally agrees with EP model forecasts.
The correlation data indicates continued bullish bias through April, with potential for bearish bias as we approach May.
This chart with new data points to strict risk management measures BEFORE reaching the May 9th blue wave forecast termination date.
Chart expands on click.
Results of Blue Wave forecast:
