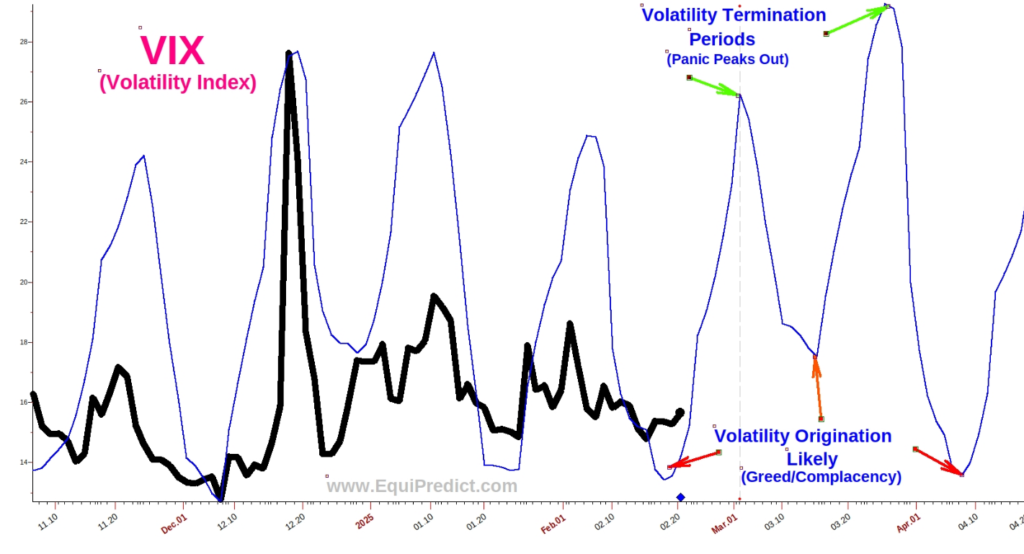
The chart included here may be new to some. The black line is the CBOE Volatility Index, otherwise known as the VIX.
In the most basic terms, the VIX is often viewed as a measure of greed or complacency in the markets on the one hand, and panic and fear on the other.
When the index falls to low levels, it indicates greed or complacency among investors. When the index spikes upwards, it indicates put option buying (fear or speculation the market is going to decline). You can read more about the CBOE VIX Index HERE if you’d like.
The forecast for the VIX over the next month is telling us to expect volatility about now, some again mid March, and again after turning into April.
Extreme spikes in the VIX are often associated with panic selling. At these points in time, institutions are typically happy to pick up shares panic sold by retail investors concerned the market is only just beginning to fall further. It is not uncommon for the markets to surprise investors with steady rallies after these moments of panic.
According to the forecast, if a market selloff materializes, it would be slated to finish its corrective price action sometime between 3/20 and 4/1 (panic selling spike).