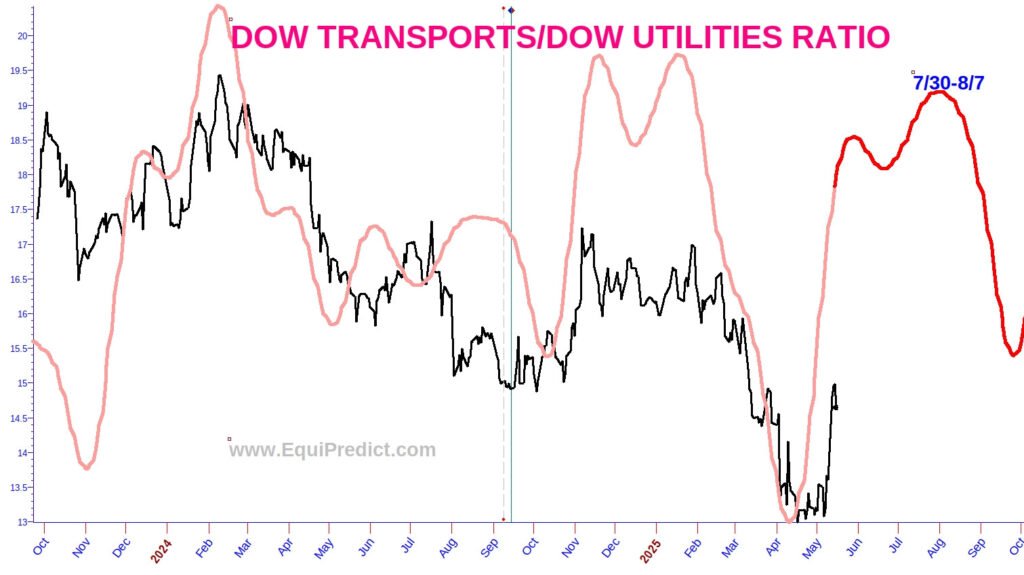
The chart included here is another chart to reference when taking the ‘pulse’ of the financial markets.
This is a ratio chart of the Dow Jones Transports (airlines, trucking, rail, logistics) vs. the Dow Jones Utilities (regulated electric, gas, and water utilities such as Edison International, American Water Works, Dominion Energy).
Here’s how to read the ratio
| Ratio Direction | What It Means | Typical Market Message |
|---|---|---|
| Black line rising | Transports ↑ vs. Utilities ↓ | Risk-on sentiment; economic activity and earnings expectations improving. |
| Black Line falling | Utilities ↑ vs. Transports ↓ | Risk-off sentiment; investors seeking defensiveness and yield. |
Current outlook:
Our cycle work points to the ratio trending higher into late July / early August. Translation: transports should continue to outperform utilities, consistent with a constructive economic backdrop for the time being.

A longer-term (larger cycle) forecast for the Dow Jones Transports/Dow Jones Utilities will be published soon.
