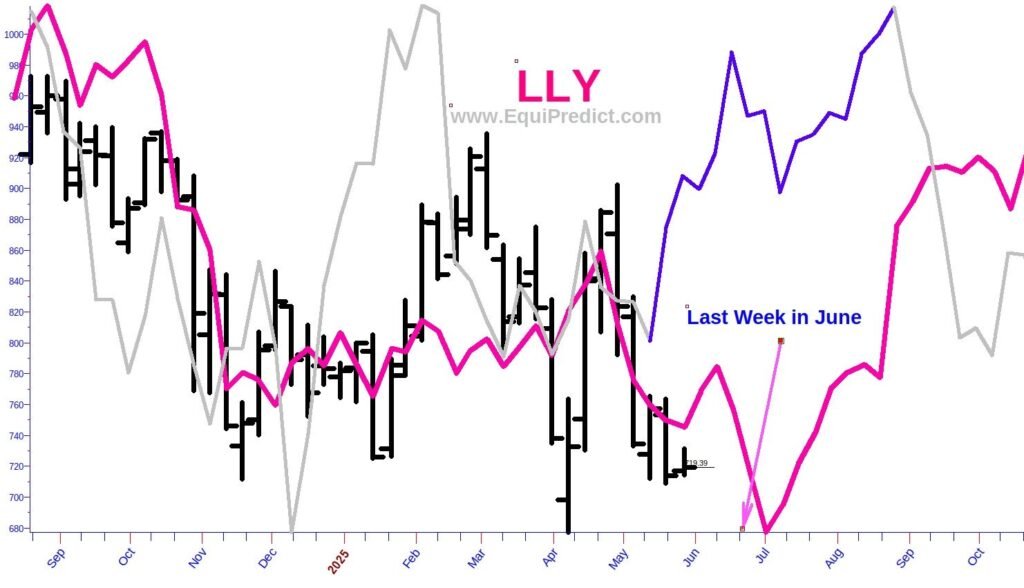
The chart included here for Eli Lilly and Company (Ticker: LLY) is pointing to a rally commencing near to the end of June. The pink line shown is a composite driver data set and the Blue Wave forecast generally agrees.
Know a Market’s Next Move — Before It Happens.
Know a Market’s Next Move — Before It Happens.
The chart included here for Eli Lilly and Company (Ticker: LLY) is pointing to a rally commencing near to the end of June. The pink line shown is a composite driver data set and the Blue Wave forecast generally agrees.