The chart presented here may be new to some. It tracks the equity Put-to-Call Ratio, a measure of sentiment among options traders. In simple terms:
- Puts are bearish bets.
- Calls are bullish bets.
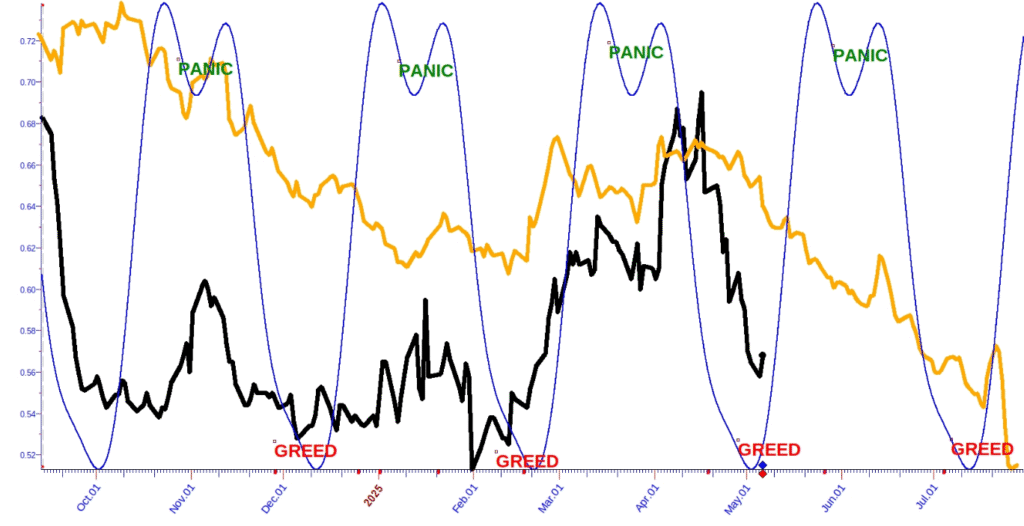
- The black line on the chart represents the ratio of puts to calls.
When the black line rises, it signals increasing bearish sentiment—often a sign of panic. Conversely, when the ratio falls, it suggests traders are becoming complacent or greedy.
Historically, sharp spikes upward in the ratio (so-called “panic tops”) tend to mark buying opportunities in the stock market, as they indicate a capitulation of bullish sentiment—meaning most sellers may have already exited. A clear example is the mid-April 2025 spike, which coincided with a market bottom.
On the chart:
- The orange line represents a composite forecast based on exogenous data, offering forward-looking insight into the Put-to-Call Ratio.
- The blue line reflects a static cycle that has been reliably tracking sentiment extremes since 2024.
According to the forecast:
- The blue cycle suggests we may see another panic low between late May and early June, followed by a greed-driven high in early to mid-July.
- The exogenous composite suggests the market is likely to remain in a state of complacency until mid-July.
Bottom line: Based on these indicators, we’re unlikely to revisit the April 2025 panic lows between now and July. Remember—when the Put-to-Call Ratio spikes, the stock market is often near a bottom.
Chart expands upon click