The following charts are of the Dow Jones Industrial Average. Please read post in its entirety as critical information on use and interpretation of this forecast is contained within the post.
Included here is a Blue Wave forecast that has occurred 14 times since the Dow Jones began trading in the 1800s. Note: The Blue Wave forecast is not part of an annual forecast.
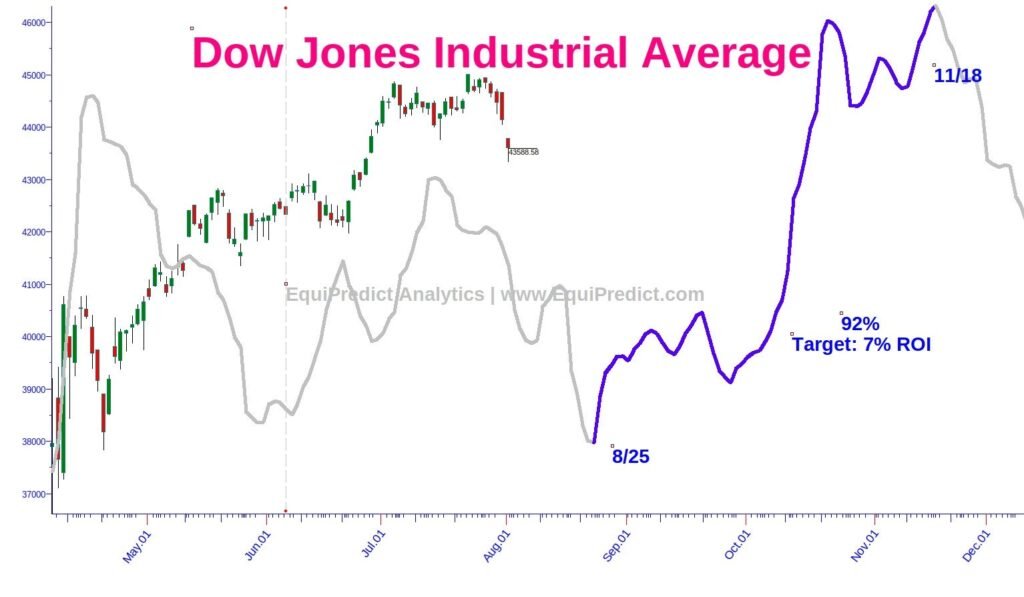
The Blue Wave found here has resulted in a positive return 92% of the time with an average return of 7%. The dates marking the beginning and termination of the wave are found on Chart 1.
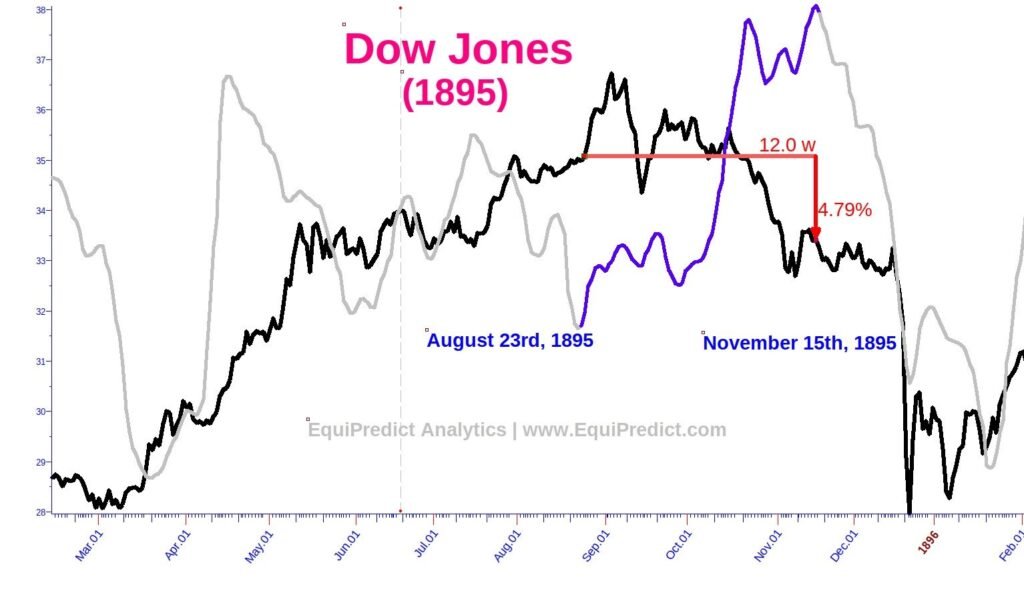
The one time in the history of the Dow Jones where the Blue Wave appeared and resulted in a loss of -4.8% was in 1895 (See Chart 2) over the 12 weeks it was in effect.
How to Use and Interpret This Forecast
For those who are longer term traders preferring “set it and forget it” trades may want to consider an entry into a Dow Jones-linked ETF (for example) or a set of Dow Jones listed Blue Chip stocks during the last week of August.*
Current forecasts point to market-wide weakness that begins in late August and lasts into October, so the “ride” along the way into late November may be a bumpy one. For example, price may remain weak or fall in the Dow Jones into November before experiencing upward thrust into late November. Nonetheless, potential for a 7% return over 3 months is significant. Price path should not be expected to follow the grey or blue line.
As a reminder, the wave shown on the chart is tied to the calendar and indicate dates of bullish bias beginning and termination; not price action magnitude.
Charts expand upon click.
*EquiPredict Analytics provides educational and informational services only and does not provide financial advice. The information contained herein is not to be taken as financial or investment advice.