Please read post in its entirety.
The chart included here is a cyclical forecast for the Nasdaq Composite (Ticker: IXIC).
The red line is an operative cycle that is currently in effect. Think of this cycle as the ‘heartbeat’ of the Nasdaq. The blue line is an EquiPredict wave that has been 95% effective at producing positive returns since 1981.
The first chart is an example of how the cycles and the EP wave worked together in 2023. Please Note: Do not expect this year to play out with a similar price-action pattern (straight up). Active participants should expect a very bumpy ride between now and mid-August 2025. Mid August 2025 is when the blue wave terminates.
Chart 1: 2023 Example (Click to Expand)
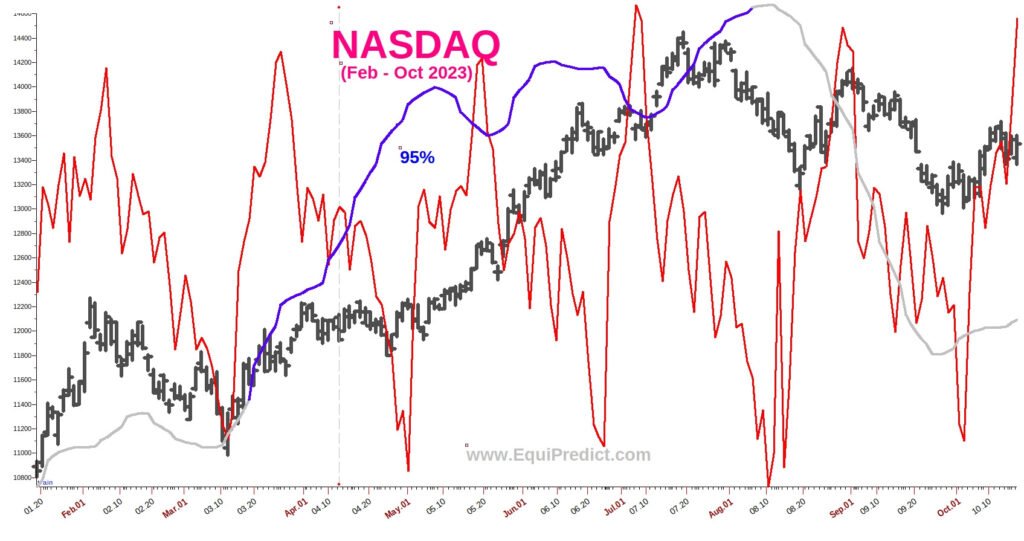
Chart 2: Current Cyclical Forecast and EP Wave (Click to Expand)
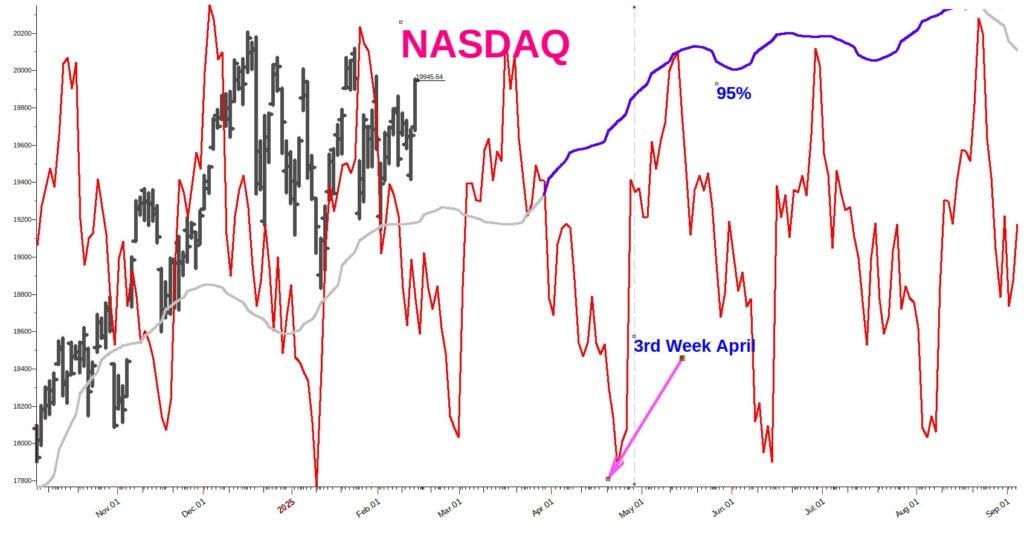
Emphasis should be given to entries in late April as this is when the operative cycle and the blue wave “agree”. Between now and then, volatility should be expected, especially as we enter into March 2025.