As we approach a local period of uncertainty in the stock market, we’re now looking to next-best entries into the various indices.
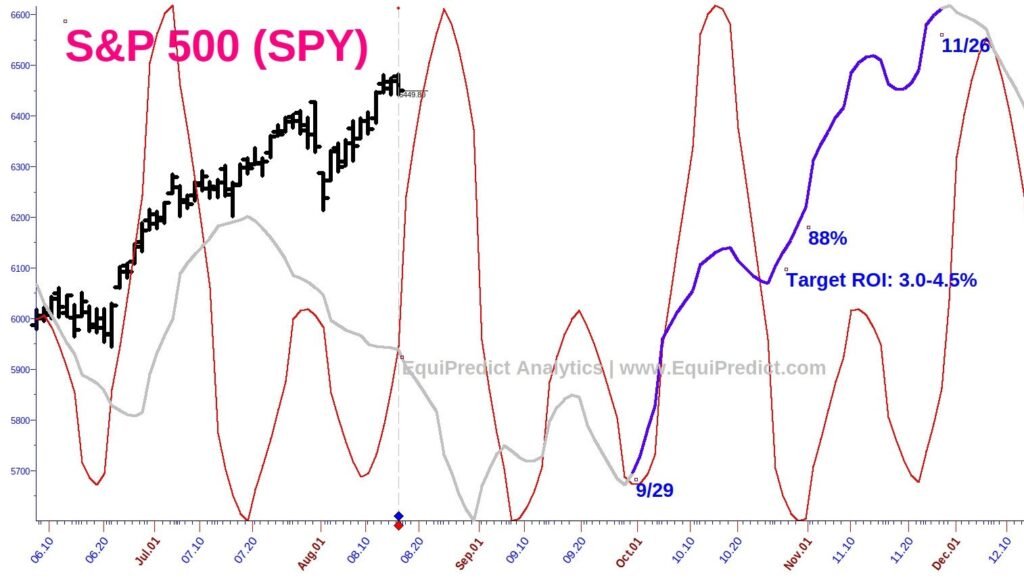
The chart below is a daily chart of the S&P 500. There is an operative Red Wave cycle present, and an 88% Blue Wave forecast has been overlaid with a target ROI of 3-4.5% between the dates shown.
For those who prefer ETFs, this trade can be taken advantage of using an ETF like the well-known SPY or the Vanguard S&P 500 VOO
Chart expands upon click.