Going forward, every 2-3 months a “summary of findings” will be published providing active market participants information to gain a higher-level view of the markets.
The objective of these postings will be to help keep perspective on financial market cycles, Wall Street rotations, and arm group members here with risk-management information.
Sample of findings covered:
- Growth vs. Value forecasts – added 4/30/25
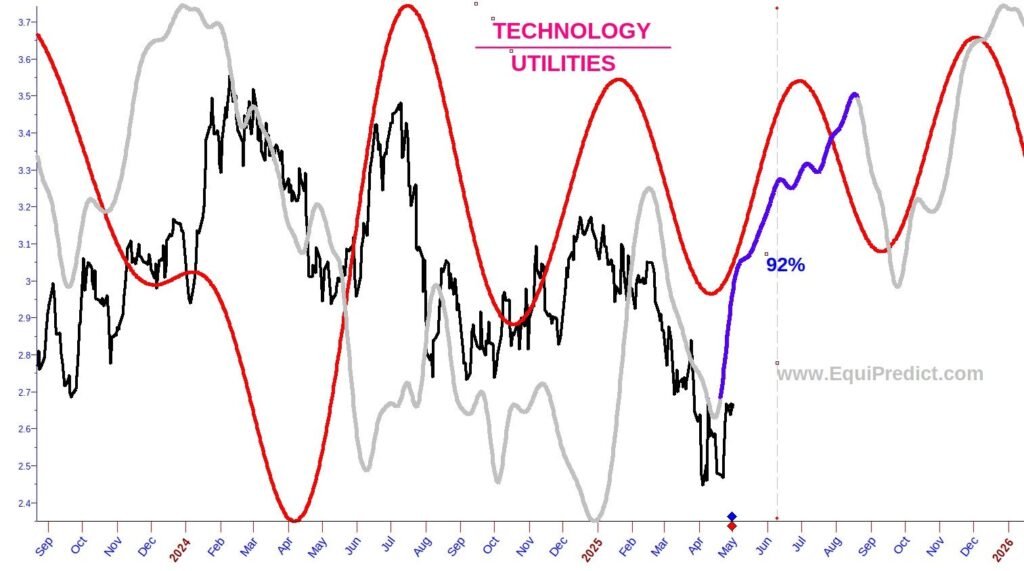
- Technology (risk) vs. Utilities (‘safety’) – added 5/1/25
- Large Cap vs. Small Cap forecasts
- Riskier Assets (i.e. QQQ) vs. Safe-Haven assets (Dow Jones)
- Consumer Discretionary Stocks vs. Consumer Staples Stocks
- …and more
For example, if Wall Street is forecasted to rotate toward a large cap consumer staples stock (like Proctor and Gamble) and away from a small-cap growth stock (like Altice USA), then for most retail traders, it would be wise to adjust risk management measures to be more aligned with Wall Street going forward.
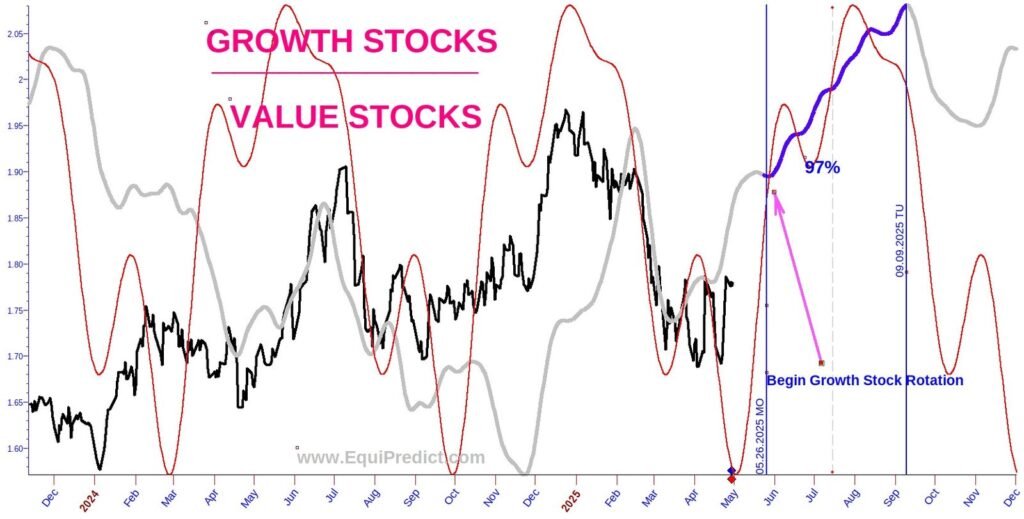
An example of a current Growth vs. Value rotation forecast is shared below. This is a Blue Wave forecast only, with a very high probability of occurrence. It is important to note the ratio line will not necessary follow the path of the Blue Wave forecast line, but from beginning in late May 2025, to end in early September 2025, the likelihood is extremely high growth stocks will have outperformed value stocks.
Here is the “net net” of how to interpret the forecast below: As the black line is rising, it indicates Wall Street is rotating toward GROWTH stocks (i.e. – META). If the black line is falling, it indicates Wall Street is rotating toward VALUE stocks (i.e. PG). It is clear since early December 2024, Wall Street has been rotating funds toward value stocks. A rising or falling of the line does not necessarily mean growth or value stocks are rising or falling in price – only that Wall Street is favoring one group of equities over the other.
Note: the greyed-out portions of the forecast line should be largely ignored.
All charts expand upon click.
The next chart below (added 5/1/25) outlines rotations by Wall Street from Technology-geared stocks (riskier equities) to Utility stocks (considered safe-haven equities). The Red Wave forecast should be used as a guideline when understanding risk rotations in the market. It is currently forecasting a rotation for the time being toward Technology stocks and away from Utility stocks into mid July (this is a common seasonal occurrence regardless of the forecast).
From there, a potential rotation toward Utility stocks, and another rotation toward Technology stocks to finish out 2025. It is important to remember forecasts are not perfect. Rotations can fluctuate. For example, last year Utility stocks began to outperform at a time the market was bullish on Technology. But this was due to the fact a perceived demand in electricity due to AI and Semiconductors would increase revenues and profits of Utility companies. Rotational forecasts should be used as guidelines only (roadmaps) for the weeks and months ahead.