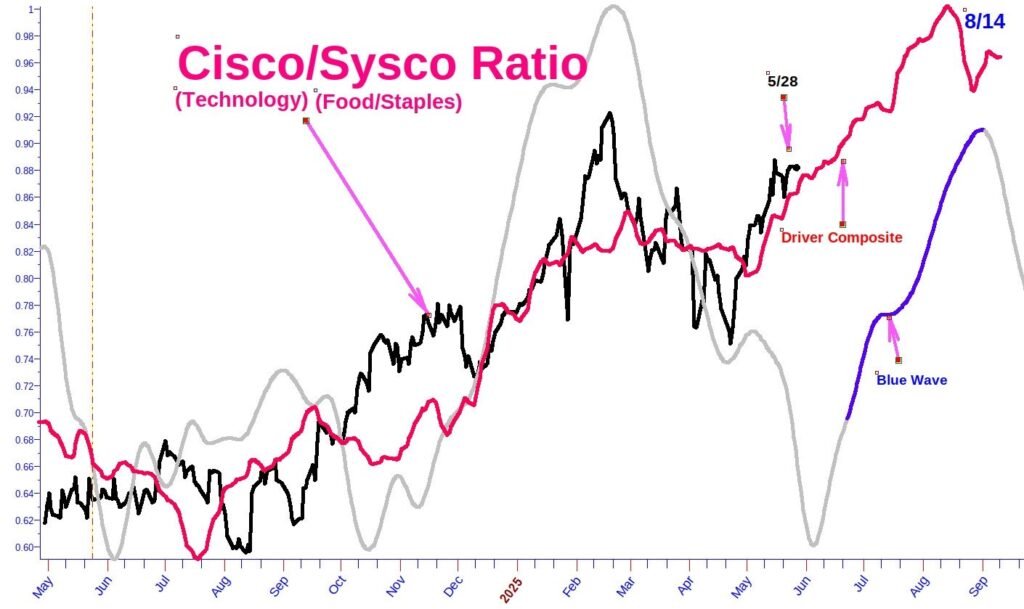
The chart included here is another ratio chart pointing to “risk on” by Wall Street until mid-August. This comparison of performance between technology (Cisco Systems) and food/staples products (Sysco Corporation) is a ratio I make a habit of looking at on a semi-annual basis.
As expected, the easy-to-remember ratio tends to be very cyclical in nature, and provides excellent insights into Wall Street’s risk appetite. As shown on the chart, the ratio line plummeted in early February, indicating significant outperformance by consumer staples until mid-April.
A market driving composite (Red Line, non-cyclical) in concert with a high probability Blue Wave forecast indicates continued out-performance by technology stocks over staples stocks going into early to mid-August.
At the end of July, we’ll be conducting and sharing a significant amount of market and equity forecast information due to the fact models are showing potential weakness in the markets after August and rotation towards VALUE over GROWTH.
Chart expands upon click