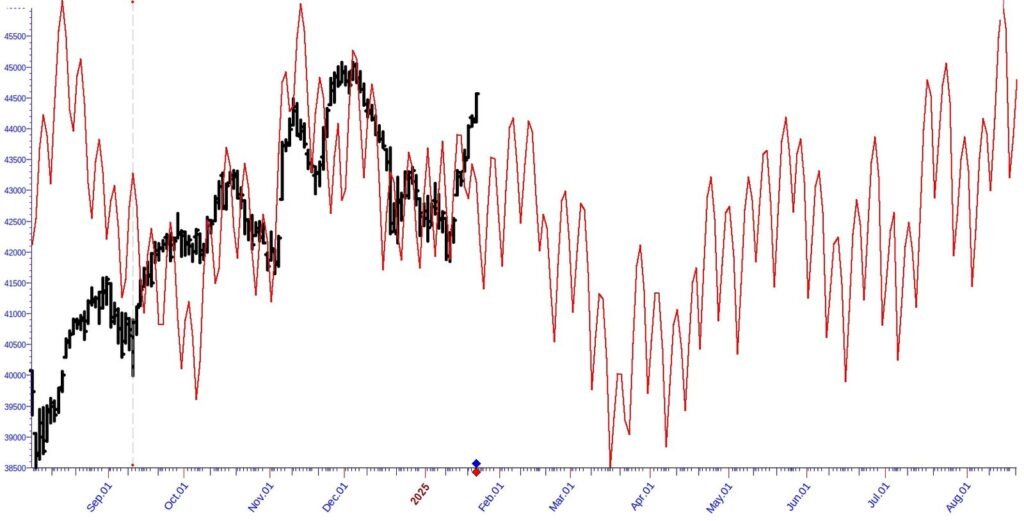
The 1st chart is from an archived and unpublished Dow Jones forecast from January of this year, 2025. The forecast used a vibrational model to provide a roadmap of where the Dow Jones might be headed in 2025.
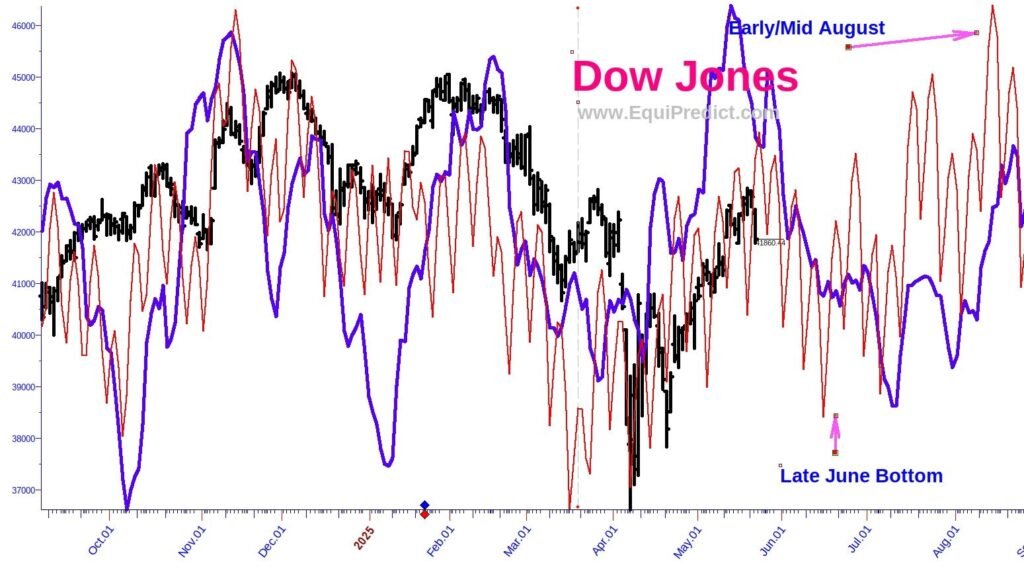
The 2nd chart is the result, with data up to today, May 21st 2025.
The original forecast called for a bottoming in mid-March, and another in mid-April. The mid-March low was a whipsaw, but the mid-April bottom was spot on. The 3rd chart is an alternate model with fewer harmonics, indicating a similar pathway.
The forecast is pointing to weakness between now and late June, and a topping pattern to look for in August. For those who are more active traders, there is an argument to be made for raising cash as a cautionary measure right here, right now.
A new forecast for the Dow Jones (as a representative for the entire stock market) will be re-run the 1st week of August.
Charts expand on click