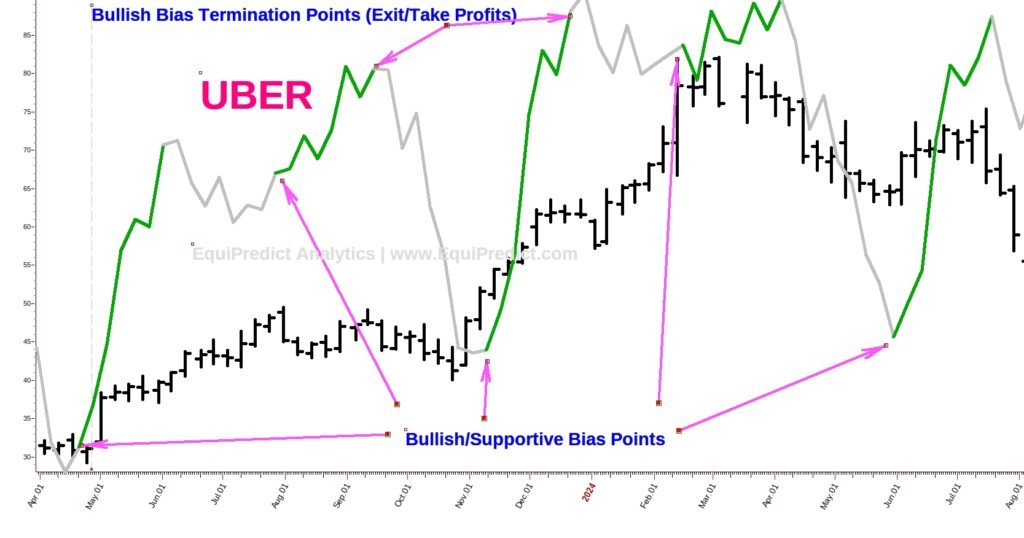
The charts below focus on Uber Technologies (Ticker: UBER) and illustrate how EquiPredict’s Red Wave and Green Wave models are used to assess market risk and directional bias.
The Green Wave highlights are designed to identify periods where bullish bias historically emerges, helping traders and investors focus on favorable conditions between clearly defined origination and termination points.
The first chart demonstrates how these highlighted Green Wave windows operated during 2023 and 2024, offering insight into periods where upside bias was present without relying on short-term price noise.
The second chart extends this framework forward, presenting a model-based forecast into July 2026. This forward-looking view incorporates both Red Wave risk structures and Green Wave opportunity windows to help frame expectations for the months ahead.
Charts expand on click. The full forecast chart and projected directional bias remain available to EquiPredict Analytics subscribers only.
Get the Free Monthly Sentiment Outlook
Stay ahead of market tone with our free monthly sentiment forecast for the Dow Jones, S&P 500, and Nasdaq. Delivered by email before each new month begins. Available for a limited time as we expand our forecasting coverage.
Get This Month’s Sentiment Forecast FreeNo credit card required • Unsubscribe anytime