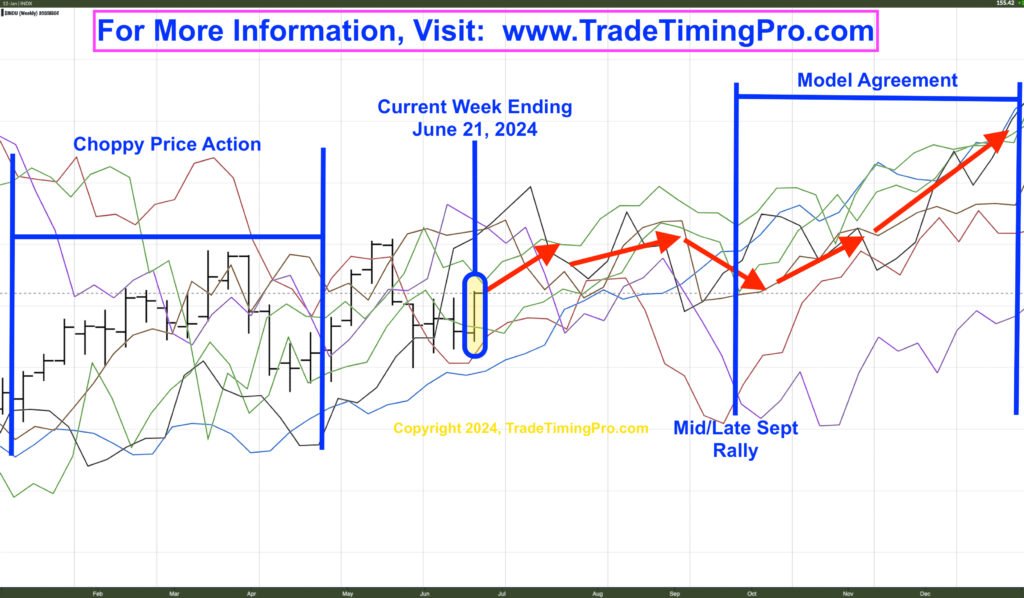
2024 Mid-Year Dow Jones Industrial Average Forecast

On the one hand, the chart above is vitally important. On the other, it could be considered merely a forecast for entertainment purposes only.
But at the core of this model, we have one thing that’s for certain: We have a general roadmap to use for 2024 when looking at the Dow Jones.
The black OHLC bars are the current track of the Dow Jones Industrial Average. The colored lines are modelling we have produced to make a best attempt at forecasting the track of the Dow Jones for 2024.
Without getting too far into the weeds, we can draw a few conclusions from this chart:
- The model was in disagreement into to late April. Price action was projected to be choppy. Frankly, it has been; so the model was correct in this regard.
- The model projects a rally into mid July from the late April low.
- There is agreement in the model of sideways action (pinching) until an August decline into late September.
- Most importantly, nearly every model agrees on a rally from late September through the end of the year with a possible pause or period of weakness inside November.
- And lastly, each model projects the year ending higher than where we are right now.
Happy trading.
