
The Price of Olive Oil as a Leading Indicator for the Stock Market
The price of olive oil has been tracked by the St. Louis Federal Reserve since January of 1990 (Note: There may be other sources of olive oil prices going back further than 1990). Regardless, by looking at the long term chart, one can see the price is cyclical. This cyclical nature makes it ripe for the picking when it comes to inter-market relationship examination.
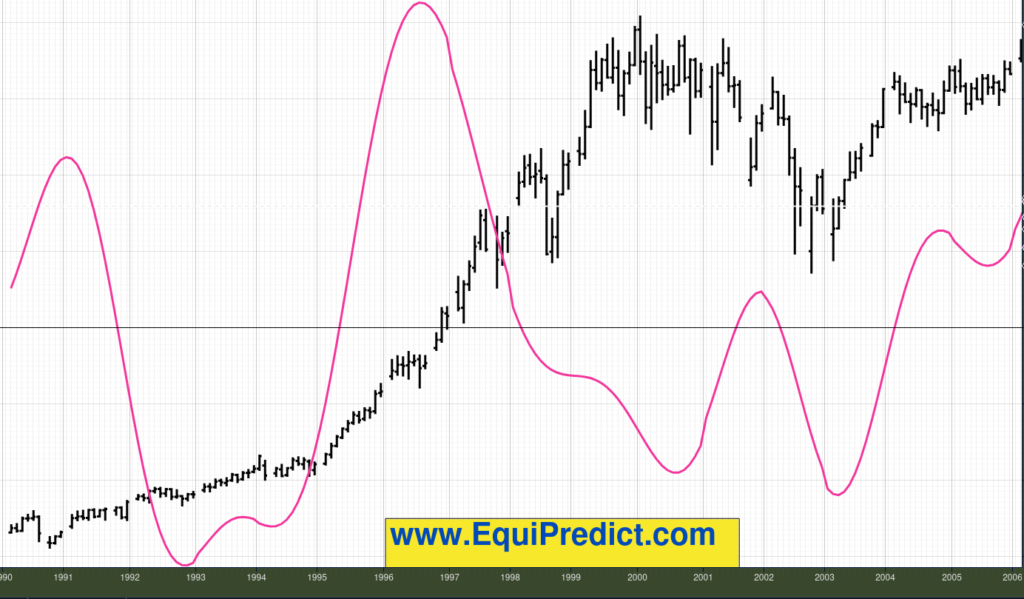
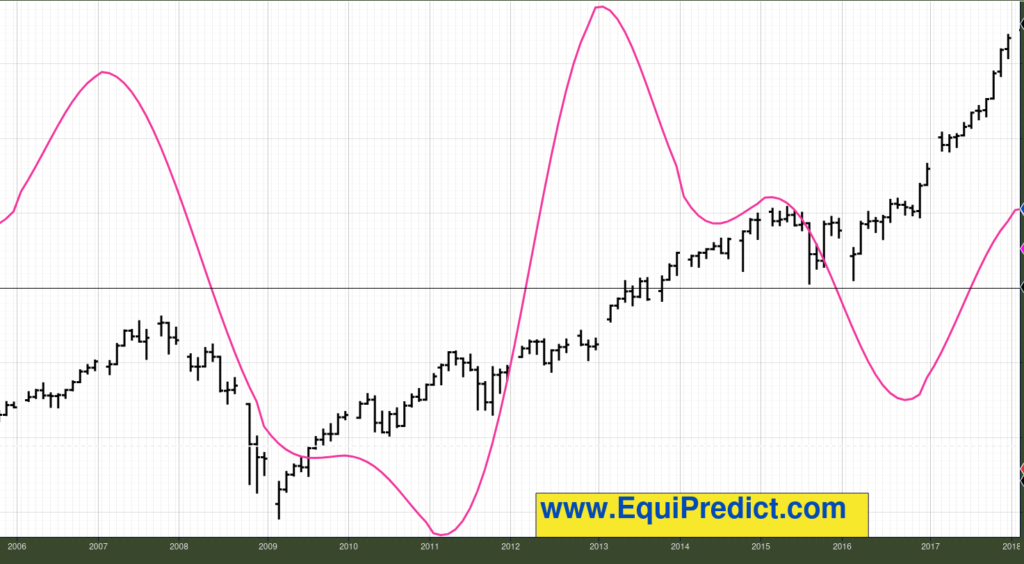
The charts included here (click each one to expand) are of the CYCLE of the price of olive oil (pink line) overlaid on the Dow Jones Industrial Average (black bars).
Going back to 1990, whenever the cycle of the price of olive oil began to roll over, a downturn or period of sideways consolidation occurred in the stock market afterward. The downturns sometimes came a year or two later (the 2000 dot-com bubble bursting, for example).
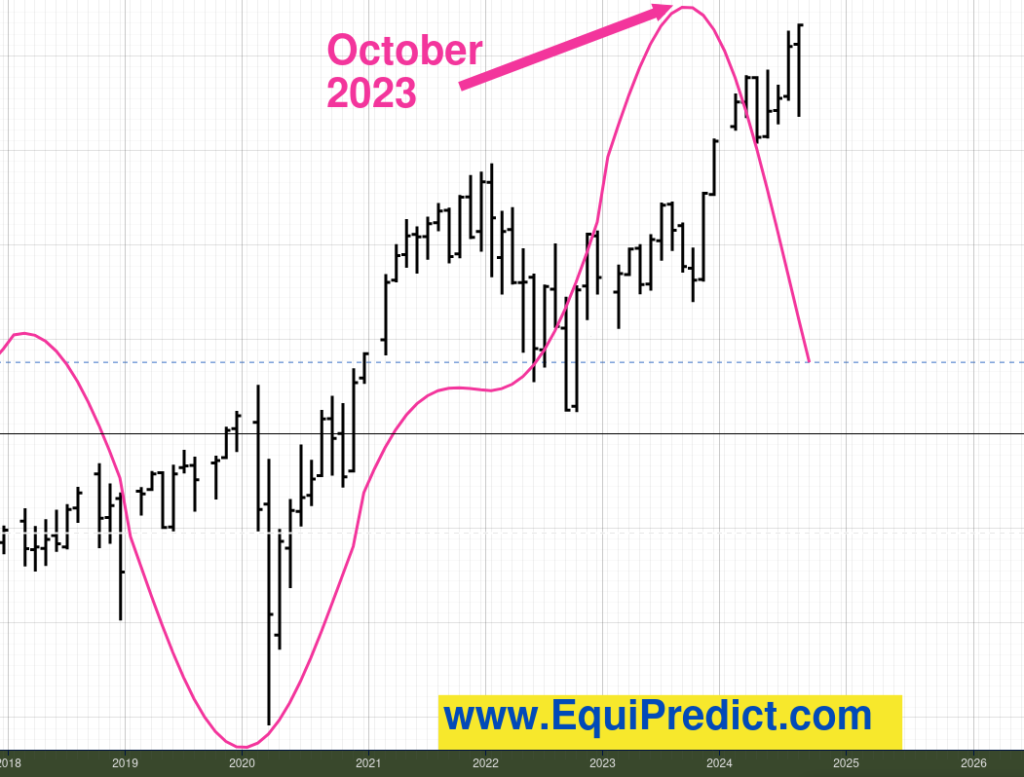
The current cycle of the price of this delectable restaurant-staple started turning over back in October of 2023 which is forecasting a coming period of consolidation at best, and a significant correction at worst.
The good news? Whenever this cycle starts to turn up, it’s most certainly time to get long and buy up shares across the board.
The next definitive up-turn in this cycle (not shown on charts here) is October 2027 – plan ahead!