At EquiPredict Analytics, one of the core forecasting tools we utilize is exogenous data driver sets. These data “drivers” are external variables that tend to lead and influence price action — helping to anticipate market movements before they happen.
When an EquiPredict Red Wave or Blue Wave forecast aligns with an exogenous data driver forecast, the probability of an accurate outcome increases significantly. This layered approach strengthens conviction by combining internal price behavior with external leading indicators.
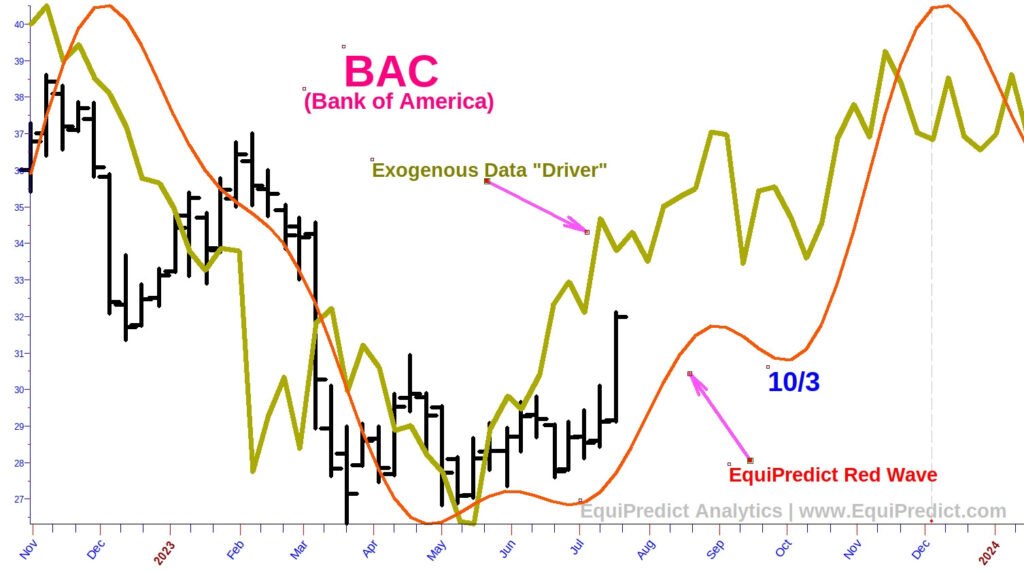
To illustrate this strategy, here’s the 2023 weekly chart of Bank of America (Ticker: BAC) below.
In mid-July 2023, Bank of America stock began to break out. At that point, the exogenous driver forecast was already signaling a bullish bias extending into 2024. However, our Red Wave forecast suggested that a more favorable entry point would occur in early October.
The Forecast Result
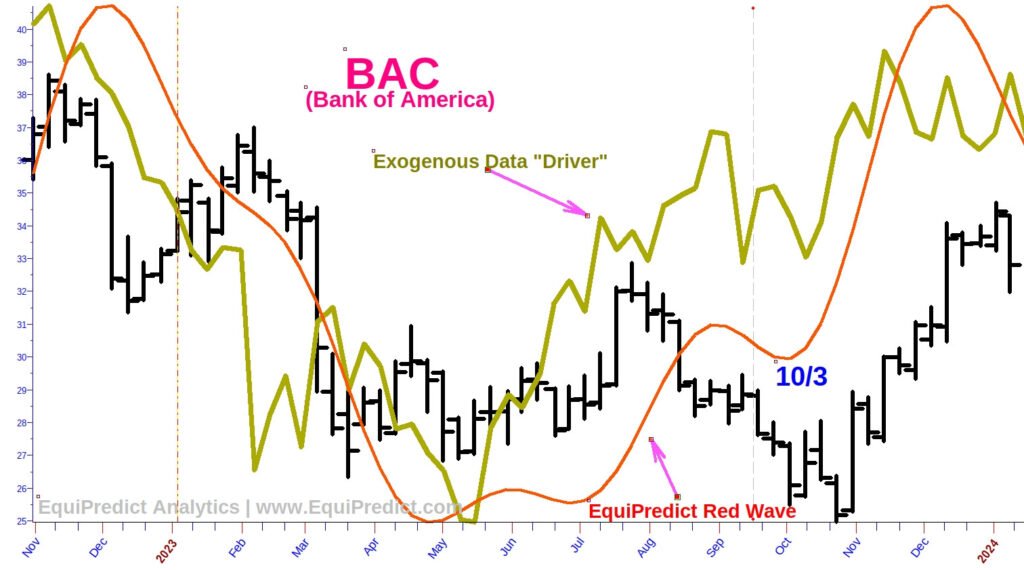
The price indeed pulled back into early October, around $26 per share, before rebounding strongly by early November. By mid-December 2023, BAC stock had climbed to approximately $34 per share — a 30% increase in just a few months. This forecast alignment helped identify both optimal timing and market bias, improving the quality of the trade.
Important Note:
EquiPredict forecasts do not predict the magnitude of price moves. Our models provide a calendar-based directional bias (bullish or bearish), not specific price targets.
An updated Bank of America forecast is available now in the Equity Forecast Charts section of the Subscriber Area.