Important Amazon.com Stock (AMZN) Forecast Update
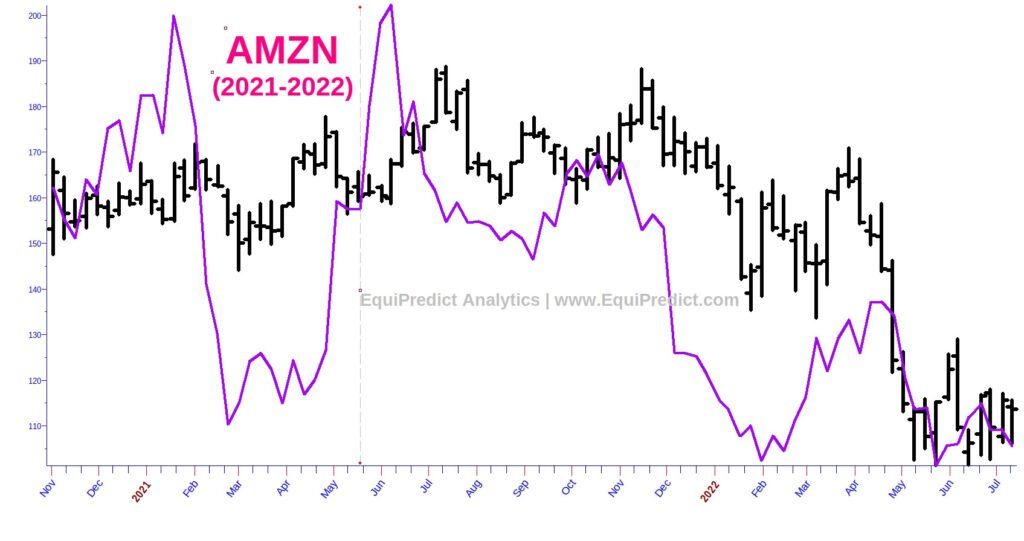
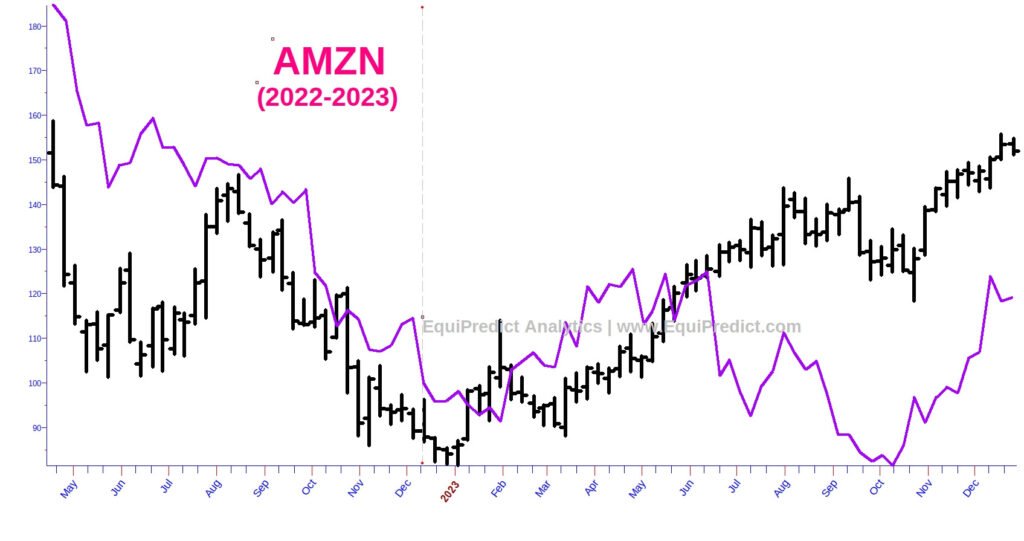
Included here are weekly charts of Amazon.com’s stock (Ticker: AMZN) with a leading indicator overlaid on the charts (purple line).
The leading indicator (exogenous data composite) is pushed forward in time and has provided an excellent roadmap for the behavior of Amazon’s stock since 2020 – and is one of the best we have uncovered for Amazon thus far.
The charts below from 2021-2023 show how this leading indicator has called turns in the stock throughout time.
An updated forecast for Amazon’s stock is now available in the Equity Forecast Charts section of the website.
To sign up for the free once quarterly EquiPredict Analytics forecast, visit our sign-up page here.