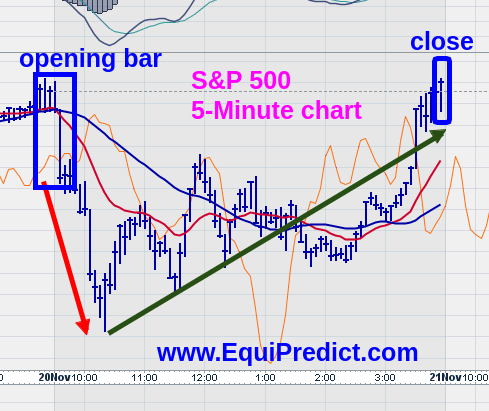
The chart included with this post is a 5-minute OHLC bar chart of the S&P 500 represented by the SPDR S&P 500 ETF (Ticker: SPY).
We’re sharing this chart to lay bare classic market maker behavior. This is behavior they exhibit in order to “maintain liquidity in the markets”.
Today, after the opening bell, the markets plummeted almost 1% until about 10:30am. From there, it was a choppy ride – all the way back up to the day’s open.
This “shake out” as we like to call it is a classic signature move of Wall Street market makers. Their intention is to get you to panic sell your shares into their hands, only to buy them back at a higher price later during a “fear of missing out” rally.
Don’t fall into this trap.
We provide our readers a free monthly EquiPredict forecast. You can sign up for that free forecast here.
To your success!
