We are excited to share we are developing a new forecasting algorithm that is thus far looking very promising.
Going forward, we will classify and refer to these specific forecasts as “green wave” forecasts. At times they will be integrated into the EquiPredict model forecasts; at other times they will be independent forecasts.
To find these in the archives going forward, search for “green wave” in the search box.
The accuracy of these green wave forecasts is substantially higher, but these forecasts are a great deal more challenging to produce.
Included here is the chart of Microsoft (Ticker: MSFT) to illustrate how these green wave forecasts work. Each chart below expands on click and best viewed on a desktop/laptop.
We are providing in this post three charts.
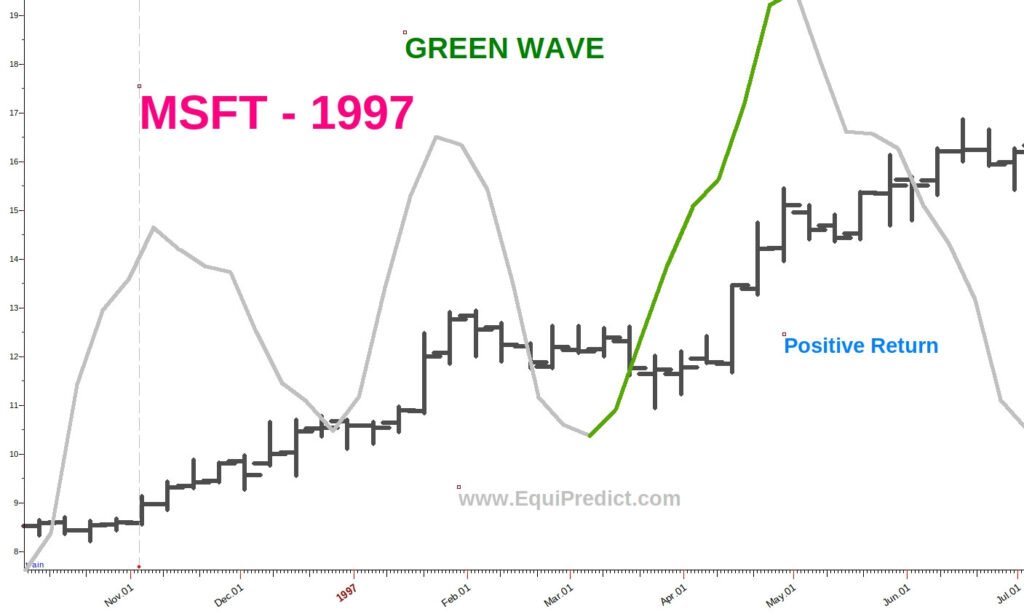
The first two charts are examples of how the green wave can provide a forecast resulting in a positive return, but also how it can produce a forecast that ultimately results in a break-even or loss.
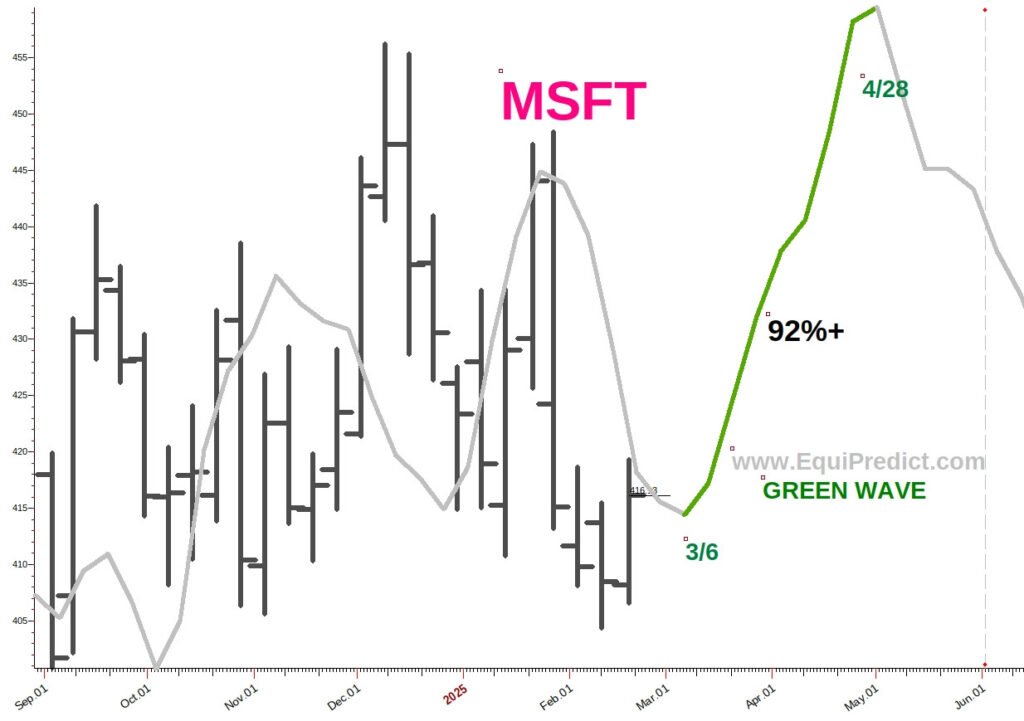
The third and final chart is the next green wave forecast in 2025 for Microsoft.
The 1st chart is the green wave in operation in 1997 for MSFT. The wave produced a positive return.
As no forecasting system is perfect, the 2nd chart is an example of how the green wave was in operation in 1989 but provided a break-even return. NOTE: The green wave forecast can conceivably result in a negative return (loss of capital).
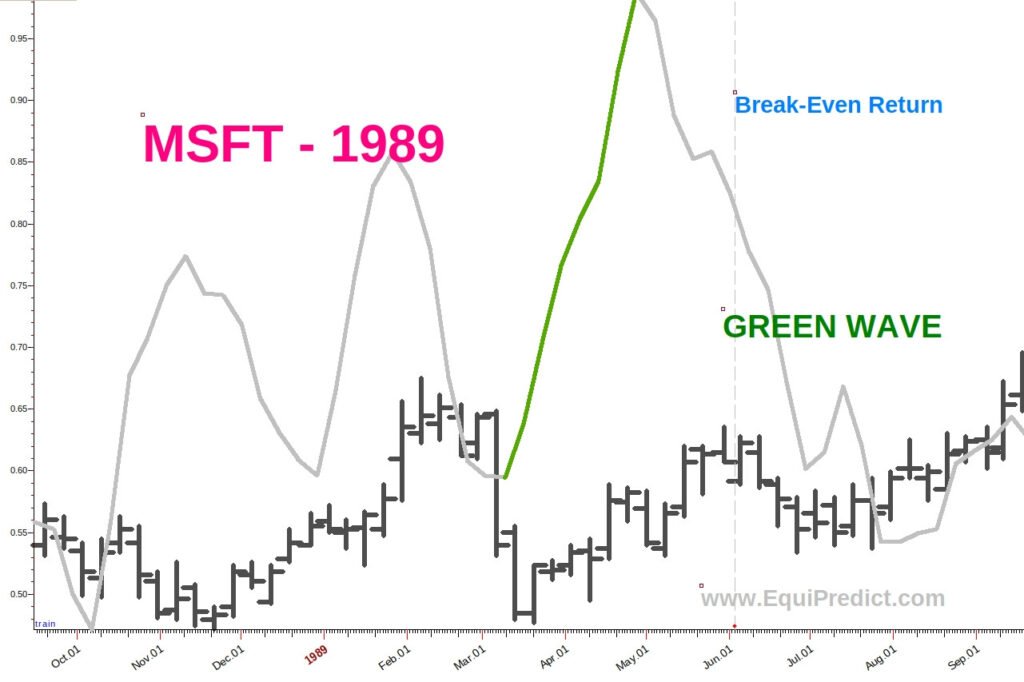
Chart #3 is the current green wave forecast for Microsoft. It begins on March 6th 2025 and terminates on April 28th 2025 with a 92% probability attached. It is important to note EquiPredict forecasts do not forecast magnitude of the move, only the behavior of the underlying equity price.
For more information about the EquiPredict subscription model, visit the subscription page HERE.
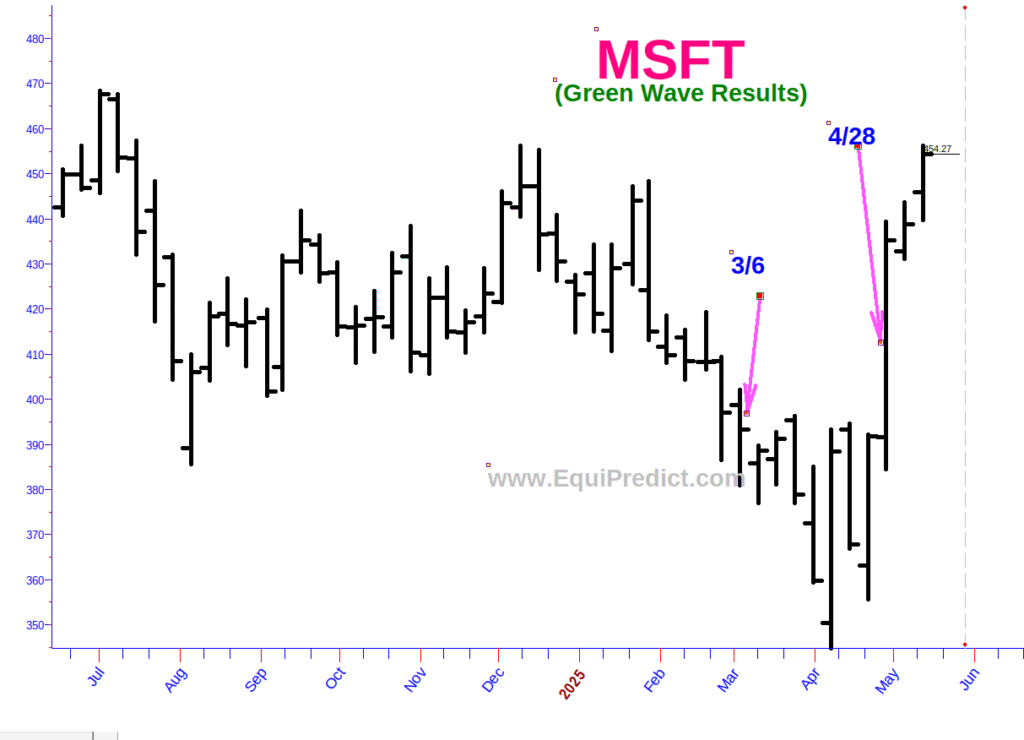
5/19/25 Edit – Green wave results:
Disclaimer: EquiPredict and/or its founder are not claiming that any account will definitely achieve profits or losses by using this service. The service and information offered here is intended for educational and informational purposes. EquiPredict is not a Registered Investment Advisor, nor a financial advisor, nor any kind of state or federally regulated investment advisory service. If you decide to invest real money, remember that all trading decisions are your responsibility and trading/investing carries risk of loss. Results and cycle timing can be influenced by any number of market factors at any moment in time. Any anticipated performance results have limitations. Any trading program is designed with the advantage of hindsight. It is important to evaluate whether trading is suitable for you given your financial condition. The owner and/or affiliated parties of EquiPredict are not responsible for any amount of loss of capital due to actions taken directly or indirectly after receiving information from EquiPredict. In other words, by subscribing to EquiPredict, you assume all risk.