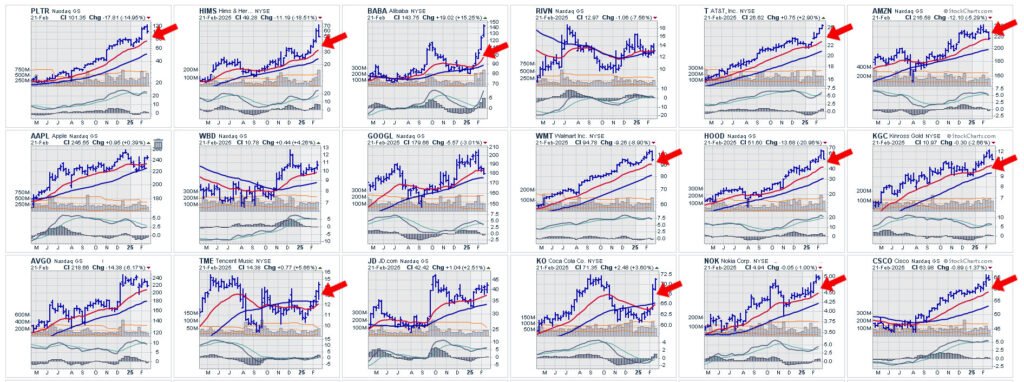
The charts included here are snapshots of just a few of the equities that have beat the S&P 500 since November. What is immediately apparent is that many of these stocks had become overextended and created an “air gap” between their price and a rising 50-week moving average (red line). When an airgap of this size occurs, profit taking and sell-offs are often in the cards.
The red arrows highlight how many of the stocks are now finding their way back to the rising 50 (a rising weekly moving average is bullish).
On February 14th, our subscribers were alerted to a bumpy ride ahead in the Nasdaq and potential selling ahead as well as a specific period of time when many of these stocks are going to be a better buy.
In our opinion, right now it’s time to “watch, wait, and go shopping” for good stocks to re-buy later.
To try out the free monthly EquiPredict forecast, sign up here to have it delivered right to your inbox along with occasional market alerts.