Your Exclusive Bear Market Roadmap (A Must Read)
The following charts are meant to serve as a roadmap for our readers. No one indicator is perfect, but what is included here is as close to perfect in the financial market forecasting world as it gets.
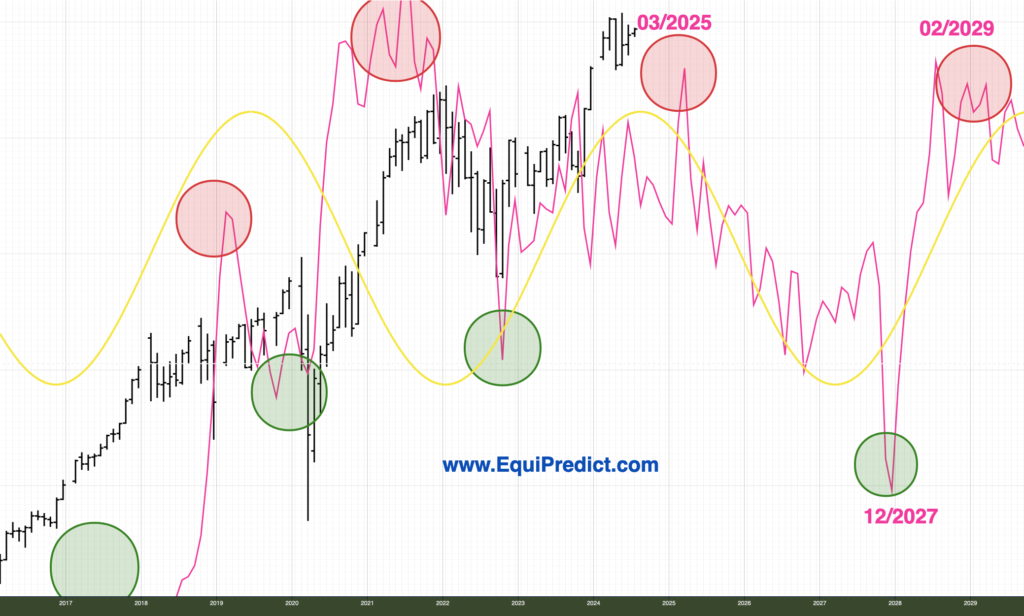
These charts foretell a “warning light” that will turn on around March of 2025. A warning light does not indicate a guaranteed bear market, however. It indicates heightened risk for one or a period of consolidation (sideways action).
Make no mistake about it, we’re still in a strong bull market phase; but it is now in late stages.
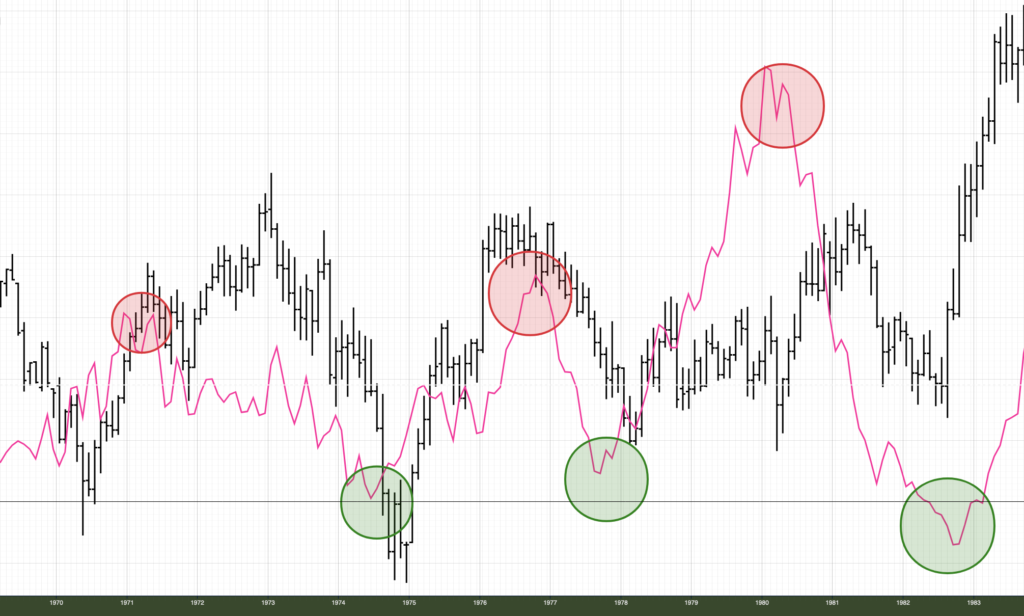
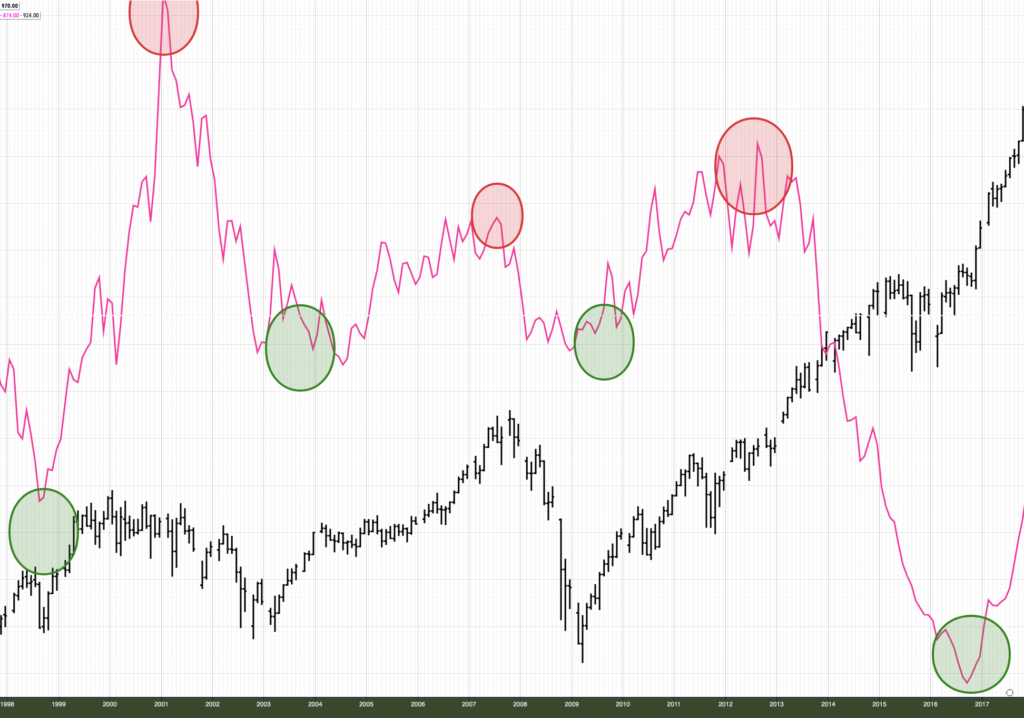
The pink line is the CYCLE of housing starts, month over month, pushed forward by 91 months – or 7.5 years.
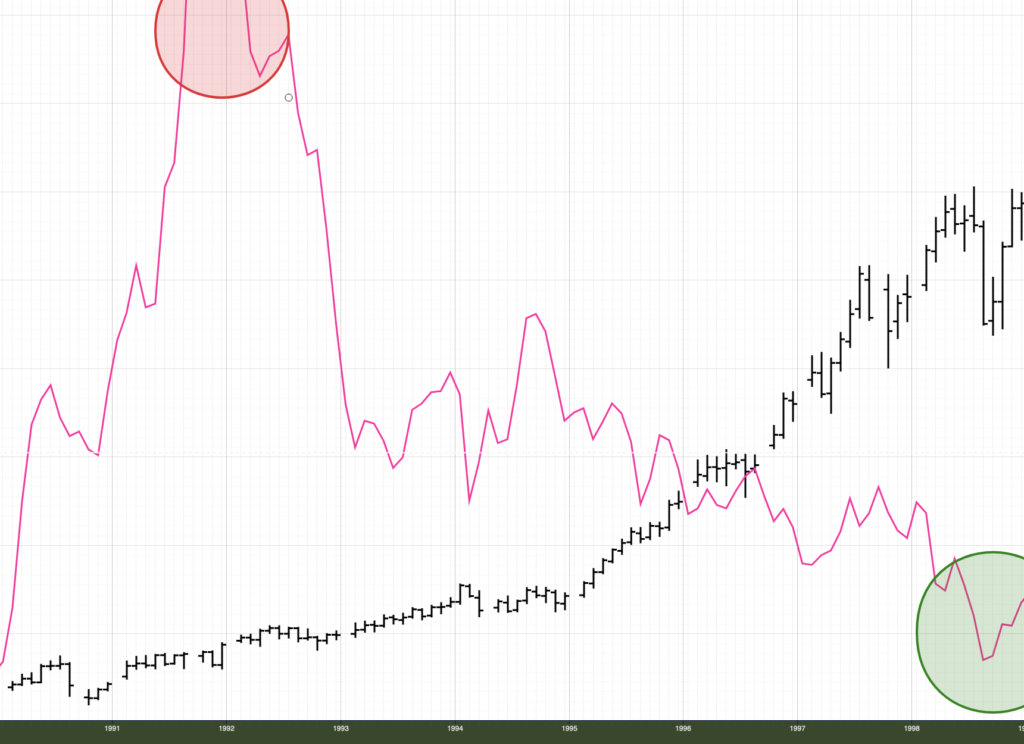
The black OHLC bars is the Dow Jones Industrial Average (Ticker: DJI).
Note: the 7 year period from 1991 – 1998 yielded uncorrelated data and was not able to forecast the 1994-1998 rally.
The charts begin tracking the Dow Jones in 1969.
Good luck, and good trading.