
Here’s a Chart Wall Street Doesn’t Want You to See
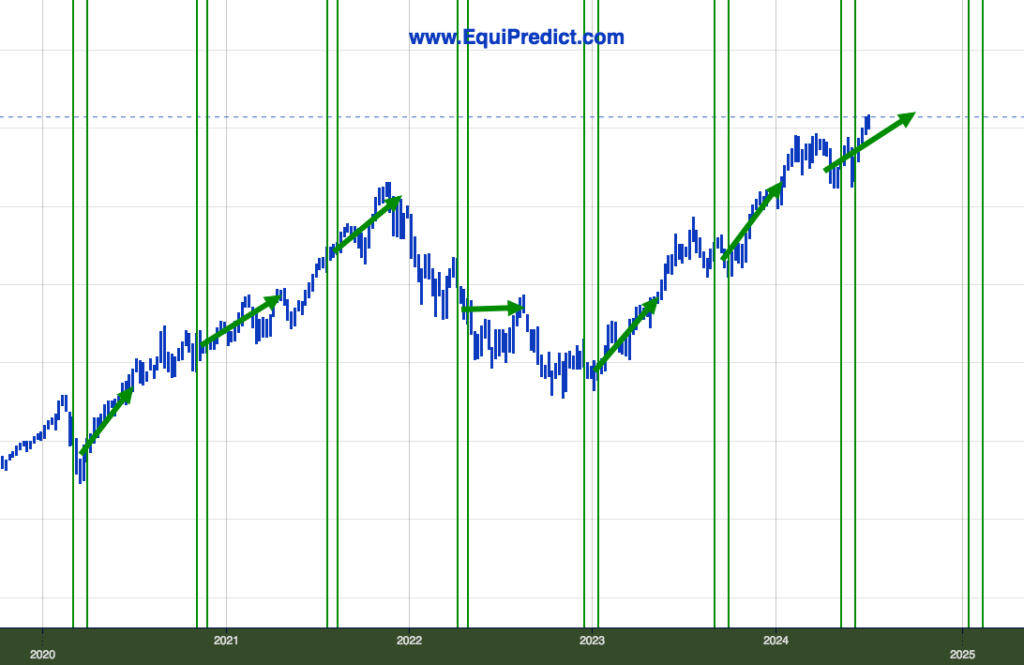
The chart included here is a key to wealth generation in the financial markets. This chart is a weekly chart of the Software Industry.
Investors who are aware of this cycle have for many years managed to profit (and very seldom, at worst break even) every 17-18 weeks.
How can this cycle be exploited? Well, we’ve just entered into the latest cycle and the clock is ticking.
The best strategy here and now is to select a strong software stock (i.e. MSFT), and buy and hold for another few weeks, into the early fall.
Sign up to our list, or our quarterly alert here, to receive specific stock trading ideas tied to exploiting hidden stock market cycles.